
- Title
-
Microglia in the developing retina couple phagocytosis with the progression of apoptosis via P2RY12 signaling
- Authors
- Blume, Z.I., Lambert, J.M., Lovel, A.G., Mitchell, D.M.
- Source
- Full text @ Dev. Dyn.
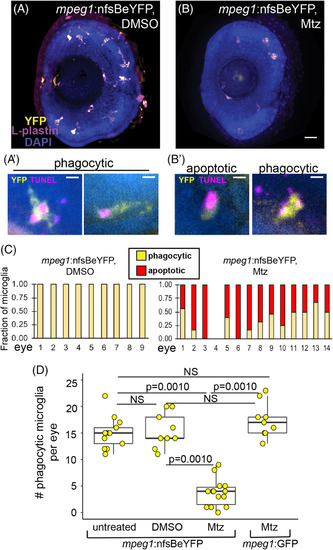
Metronidazole (Mtz)‐mediated depletion of microglia in the retina of mpeg1 :nfsBeYFP zebrafish embryos during development. (A, B), Images of whole eyes from mpeg1 :nfsBeYFP embryos following immersion in DMSO, A, or Mtz, B, from 24 to 72 hpf, stained for L‐plastin (purple) and DAPI (blue) with YFP expression also visualized (yellow). All L‐plastin+ cells in the developing retina express YFP, A, and these cells are reduced upon Mtz treatment, B. Scale bar in B = 20 μm and applies to A and B. A′. Examples of YFP+ microglia in control retinas with phagocytic morphology engulfing TUNEL+ dying cells (magenta). B′. Examples of morphology indicating apoptotic TUNEL+YFP+ microglia in retinas from mpeg1 :nfsBeYFP retinas treated with Mtz (left) and remaining phagocytic YFP+ microglia engulfing TUNEL+ puncta (right). Scale bars in A′ and B′ = 5 μm. C, YFP+ microglia in mpeg1 :nfsBeYFP retinas treated with DMSO (left) or Mtz (right) were assigned phagocytic or apoptotic morphology. Graphs show the fraction of microglia with each morphology in each eye examined. D, To determine the effective depletion, the number of phagocytic microglia in the retina in each indicated group was quantified. Box plots are shown for each group with each individual data point shown in yellow circles. A one‐way analysis of variance (ANOVA) (P = 2.04 × 10⁻¹⁴) was performed, followed by Tukey's HSD post hoc test. P values shown for pairwise comparison with P < .05; NS = not significant. Phagocytic microglia were depleted only in mpeg1 :nfsBeYFP embryos treated with Mtz. Samples sizes: mpeg1 :nfsBeYFP untreated = 13 eyes from 13 fish, mpeg1 :nfsBeYFP DMSO treated = 9 eyes from 5 fish, mpeg1 :nfsBeYFP Mtz treated = 14 eyes from 10 fish, mpeg1 :GFP Mtz treated = 9 eyes from 6 fish |
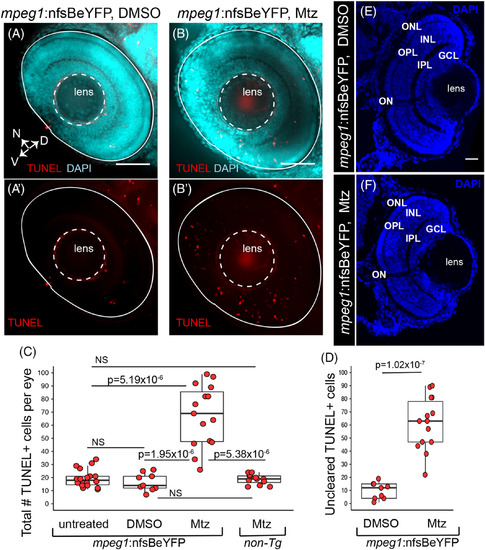
Accumulation of TUNEL+ cells in the retina when primitive microglia are depleted. Whole embryos were collected and processed for TUNEL (red) staining then DAPI (cyan) counterstaining. Images show selected z projections of whole eyes from mpeg1 :nfsBeYFP embryos treated with DMSO, (A, A′), or Mtz, (B, B′). Orientation is indicated by the compass on bottom left of panel A, N = nasal, V = ventral, D = dorsal (applies to A‐B′). The lens and boundary of the eye are indicated by white dashed outlines. C, The total number of TUNEL+ cells per eye was quantified for each indicated group. Box plots are shown for each group with each individual data point shown in red circles. A Welch's one‐way test (P = 7.27 × 10⁻⁷) was performed, followed by Bonferroni post hoc test. P values shown for pairwise comparison with P < .05; NS = not significant. D, Since TUNEL signal is often associated with YFP+ microglia (see Figure 1A′,B′), we determined the number of uncleared TUNEL+ cells in mpeg1 :nfsBeYFP retinas treated with DMSO or Mtz by subtracting the number of microglia‐associated TUNEL+ puncta from the total number of TUNEL+ cells. Box plots are shown for each group with each individual data point shown in red circles. P ‐value (Welch's t test) is shown. E and F, Comparison of gross retinal structure from retinal cryosections from control (D) or microglia depleted (E) eyes. DAPI (blue) was used to label cell nuclei and assess retinal structure. Stereotypical retinal structure is apparent for both control (E) and microglia‐depleted (F) retinas as evidenced by organized outer nuclear layer (ONL), inner nuclear layer (INL), and ganglion cell layer (GCL). The outer and inner plexiform layers (OPL and IPL, respectively) and location of the optic nerve (ON) are also apparent. Scale bar in E = 20 μm, applies to E and F. Samples sizes: mpeg1 :nfsBeYFP untreated = 18 eyes from 15 fish, mpeg1 :nfsBeYFP DMSO treated = 9 eyes from 5 fish, mpeg1 :nfsBeYFP Mtz treated = 14 eyes from 10 fish, Non‐Tg Mtz treated = 12 eyes from 6 fish |
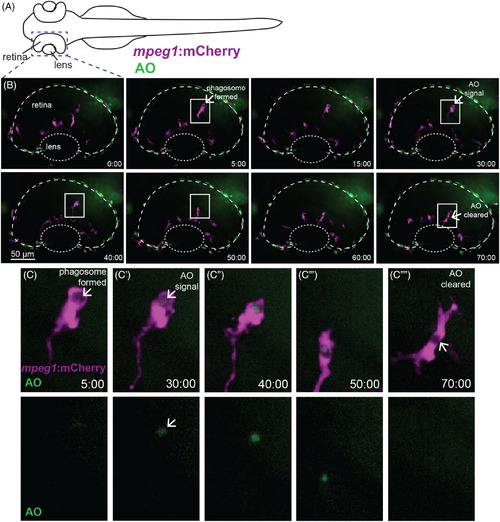
Real‐time imaging and direct observation of apoptotic cell clearance by microglia during retinal development. A, Diagram of embryonic zebrafish as positioned for live imaging, indicating the developing eye/retina and region subjected to imaging. At the time of imaging, the developing zebrafish eye consists nearly entirely of the lens and retina. Retinas of mpeg1 :mCherry embryos (to label microglia, magenta) beginning at ~54 hours postfertilization (hpf) were imaged live using confocal microscopy. Acridine orange (AO, green) was used to label apoptotic cells in vivo. Images were acquired every 5 minutes, with z stacks spanning the entire retina, for 8 hours total (ending at ~62 hpf). B, shows selected, flattened z projections and selected time‐frames from a representative imaging session. Time stamps (minute:second) are shown at bottom right of each panel, with time 0:00 at the start of the selected frames. C–C′′′′ are enlarged insets of selected regions in B outlined by white boxes, showing mpeg1 :mCherry and AO merged (top row) and AO alone (bottom row). In B and C, a phagosome is formed (arrow in second panel of B, arrow in C) ~25 minutes prior to AO signal detection inside of the phagosome (arrow in fourth panel of B, arrow in C′ top and bottom). Clearance of the AO signal occurs ~40 minutes later (arrow, final panel of B and arrow in C′′′′). Initial AO signal detection was most frequently observed already associated with mpeg1 :mCherry cells (see Figure 4C) |
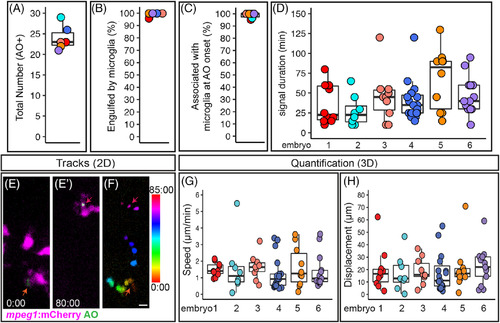
Quantification of cell death, microglial clearance, and apoptotic cell body movement detected by AO during retinal development. A‐D, Each circle is color coded for each embryo imaged, and overlaid onto box plots. A, Total number of AO+ cells observed during live imaging from ~54‐62 hours postfertilization (hpf). B, The percent of AO+ cells that were observed to be engulfed by a microglial cell during the imaging session. C, For AO+ cells observed to be cleared by microglia, the percent showing association with a microglial cell at the onset of AO+ signal. D, Each circle represents individual cells from each embryo that was imaged. A selected number of individual AO+ cells, which were observed to appear and be cleared, during the imaging session were tracked in each embryo imaged. The duration of AO signal is shown for these individual AO+ cells. E‐F represent max projections of selected, flattened z planes over a selected time‐lapse. E, Shows the initial detection of an AO+ cell (green, indicated by red‐orange arrow) associated with a microglial cell (microglia = magenta). E′, Shows the same AO+ cell (green, indicated by the magenta arrow) 80 minutes later, just before the AO signal is lost, after it had moved with the migrating microglial cell (magenta). F, The movement of the AO+ cell body was temporally color‐coded to show its dynamic movement over time; the AO+ cell was associated with a microglial cell at all time frames. The color scale on the right indicates progression of time, where the first frame corresponds to 0:00 and the last frame is 85:00 (minute:second). Scale bar in bottom right of F = 5 μm and applies to E‐F. G and H, To show a representation of dynamics of AO+ cell movement in association with microglia, a subset of AO+ cells were tracked in 3D using Imaris software. Quantifications show the speed (G) and total displacement (H) of individual AO+ cell bodies. Box plots are shown and circles are color coded to represent each embryo imaged. Each circle represents one AO+ cell that was tracked in each embryo that was imaged. Results are shown for n = 6 different embryos |
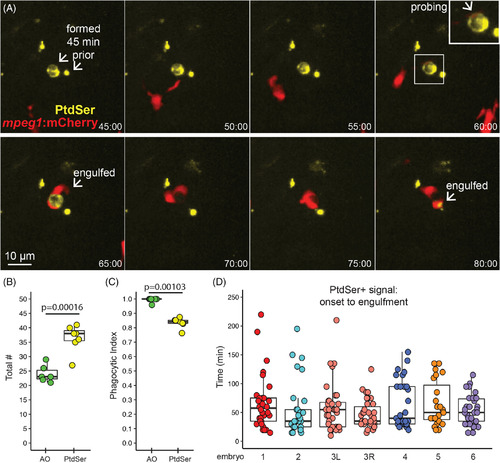
Microglial sensing of apoptotic neurons displaying Phosphatidyl Serine. A, Real‐time imaging of microglia (red) sensing retinal neurons with exposed phosphatidyl serine (PtdSer, yellow). Selected panels are shown for an imaging session. Timestamp (hour:minute, bottom right) is relative to YFP onset in the selection. In contrast to AO, YFP+ cell bodies were present (here, for ~1 hour) prior to microglial sensing, probing, and engulfment. Scale bar applies to all images. Inset (upper right panel) shows enlargement of the PtdSer+ cell probed by a microglial process. B, Box plots show total number of PtdSer+ cells (n = 6 embryos) over the imaging session, compared to AO+ numbers (n = 6 embryos). Individual circles overlaid on box plots represent each sample. P value (Student's 2‐tailed t test) is shown. C, Phagocytic index of apoptotic cells detected by AO or PtdSer. The phagocytic index is defined as the fraction of cells observed to be cleared by microglia during the imaging session. Box plots, with individual measurements overlaid (circles), are shown. P value from the generalized liner model with binomial family is shown. D, For each individual PtdSer+ cell counted, the time of PtdSer exposure from onset to microglial engulfment was calculated. Each box plot represents one eye from one embryo, except for the salmon colored plots, which show two eyes from a single embryo. Each circle overlaid on the box plot represents one PtdSer+ cell |
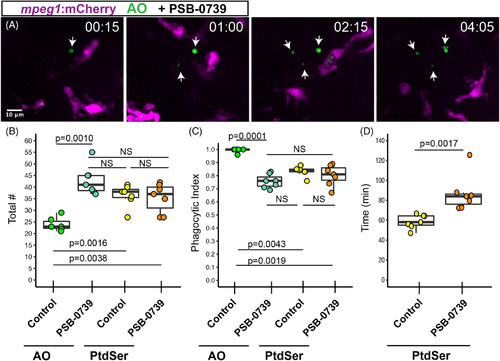
Pharmacological inhibition of P2RY12 signaling results in delayed clearance of apoptotic cells in the developing retina. Mpeg1 :mCherry embryos were pretreated with PSB‐0739 for 1 hour, then imaged with continual immersion in PSB‐0739. Acridine orange (AO, green) was used to label apoptotic cells in vivo. A. Selected z planes and timeframes are shown for imaging in the presence of PSB‐0739. Isolated AO+ cells (arrows) are detected, which are ignored by microglia. Time stamp in upper right (hour:minute) begins at appearance of the first AO+ cell (arrow, left panel). Scale bar in, A, applies to all panels. B, Box plots represent the total number of AO+ or PtdSer+ cells detected during 8 hours of imaging in control or PSB‐0739 treated retinas (n = 6‐7 eyes from 6 embryos per group). Individual measurements are shown in circles and are overlaid on the box plots. A one‐way ANOVA (P = .00016) was performed, followed by Tukey's HSD post hoc test. P values shown for pairwise comparison with P < .05; NS = not significant. An increased number of AO+ cells (late stage apoptosis) are detected in PSB‐0739 treated retinas, but the total number of PtdSer+ cells detected in control and PSB‐0739 treated retinas is not significantly different (NS). C, The phagocytic index (fraction of cells observed to be cleared by microglia) was determined for AO+ and PtdSer+ cells in control and PSB‐0739 treated retinas. Box plots, with individual measurements (overlaid circles), are shown. A generalized linear model with binomial family was used, followed by one‐way ANOVA (P = 2.97 × 10⁻¹²) followed by Tukey's post hoc. P values are shown for pairwise comparisons with P < .05, NS = not significant (n = 6‐7 eyes from 6 embryos per group). D, The time of PtdSer exposure from onset to engulfment was determined in control and PSB‐0739 treated retinas. Box plots are shown, each overlaid circle represents the average of the measurements for each embryo. (n = 7 eyes from 6 embryos per group) P value (Mann‐Whitney U test) is shown. Results indicate that time from PtdSer exposure to microglial clearance is increased in the presence of PSB‐0739 |