
Fig. 4
- ID
- ZDB-FIG-200615-29
- Publication
- Blume et al., 2020 - Microglia in the developing retina couple phagocytosis with the progression of apoptosis via P2RY12 signaling
- Other Figures
- All Figure Page
- Back to All Figure Page
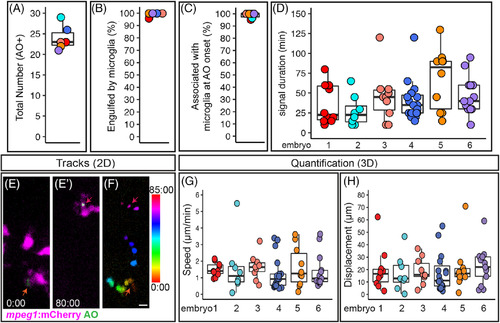
Quantification of cell death, microglial clearance, and apoptotic cell body movement detected by AO during retinal development. A‐D, Each circle is color coded for each embryo imaged, and overlaid onto box plots. A, Total number of AO+ cells observed during live imaging from ~54‐62 hours postfertilization (hpf). B, The percent of AO+ cells that were observed to be engulfed by a microglial cell during the imaging session. C, For AO+ cells observed to be cleared by microglia, the percent showing association with a microglial cell at the onset of AO+ signal. D, Each circle represents individual cells from each embryo that was imaged. A selected number of individual AO+ cells, which were observed to appear and be cleared, during the imaging session were tracked in each embryo imaged. The duration of AO signal is shown for these individual AO+ cells. E‐F represent max projections of selected, flattened z planes over a selected time‐lapse. E, Shows the initial detection of an AO+ cell (green, indicated by red‐orange arrow) associated with a microglial cell (microglia = magenta). E′, Shows the same AO+ cell (green, indicated by the magenta arrow) 80 minutes later, just before the AO signal is lost, after it had moved with the migrating microglial cell (magenta). F, The movement of the AO+ cell body was temporally color‐coded to show its dynamic movement over time; the AO+ cell was associated with a microglial cell at all time frames. The color scale on the right indicates progression of time, where the first frame corresponds to 0:00 and the last frame is 85:00 (minute:second). Scale bar in bottom right of F = 5 μm and applies to E‐F. G and H, To show a representation of dynamics of AO+ cell movement in association with microglia, a subset of AO+ cells were tracked in 3D using Imaris software. Quantifications show the speed (G) and total displacement (H) of individual AO+ cell bodies. Box plots are shown and circles are color coded to represent each embryo imaged. Each circle represents one AO+ cell that was tracked in each embryo that was imaged. Results are shown for n = 6 different embryos |