
|
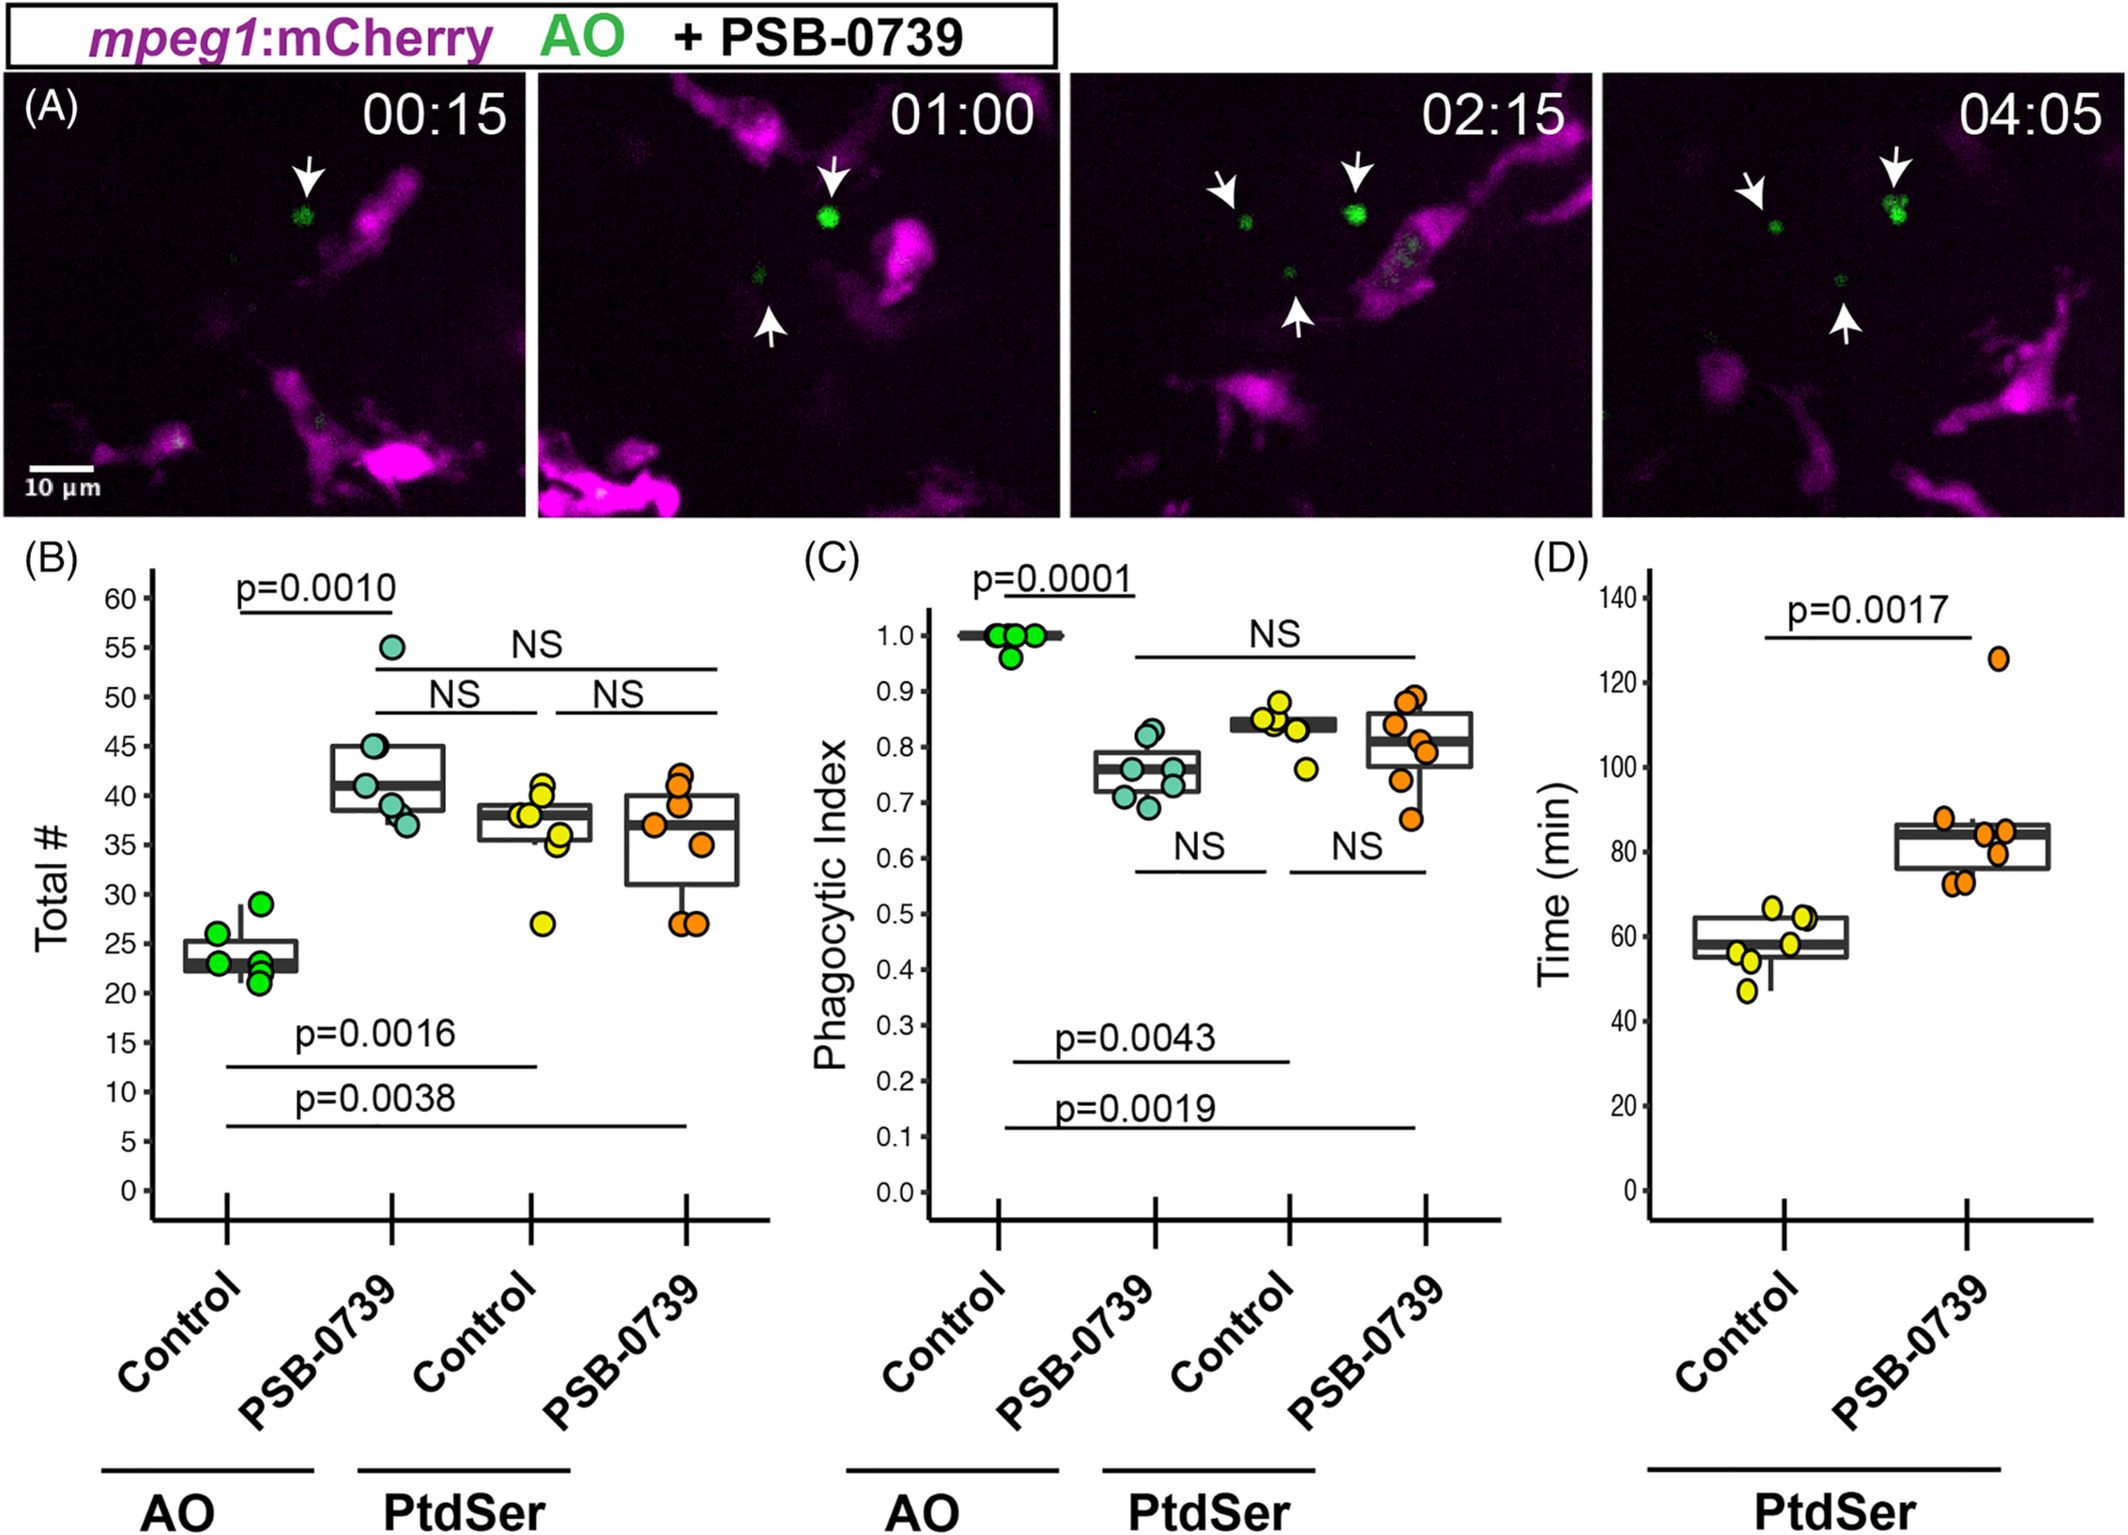
Fig. 6 Pharmacological inhibition of P2RY12 signaling results in delayed clearance of apoptotic cells in the developing retina. Mpeg1 :mCherry embryos were pretreated with PSB‐0739 for 1 hour, then imaged with continual immersion in PSB‐0739. Acridine orange (AO, green) was used to label apoptotic cells in vivo. A. Selected z planes and timeframes are shown for imaging in the presence of PSB‐0739. Isolated AO+ cells (arrows) are detected, which are ignored by microglia. Time stamp in upper right (hour:minute) begins at appearance of the first AO+ cell (arrow, left panel). Scale bar in, A, applies to all panels. B, Box plots represent the total number of AO+ or PtdSer+ cells detected during 8 hours of imaging in control or PSB‐0739 treated retinas (n = 6‐7 eyes from 6 embryos per group). Individual measurements are shown in circles and are overlaid on the box plots. A one‐way ANOVA (P = .00016) was performed, followed by Tukey's HSD post hoc test. P values shown for pairwise comparison with P < .05; NS = not significant. An increased number of AO+ cells (late stage apoptosis) are detected in PSB‐0739 treated retinas, but the total number of PtdSer+ cells detected in control and PSB‐0739 treated retinas is not significantly different (NS). C, The phagocytic index (fraction of cells observed to be cleared by microglia) was determined for AO+ and PtdSer+ cells in control and PSB‐0739 treated retinas. Box plots, with individual measurements (overlaid circles), are shown. A generalized linear model with binomial family was used, followed by one‐way ANOVA (P = 2.97 × 10⁻¹²) followed by Tukey's post hoc. P values are shown for pairwise comparisons with P < .05, NS = not significant (n = 6‐7 eyes from 6 embryos per group). D, The time of PtdSer exposure from onset to engulfment was determined in control and PSB‐0739 treated retinas. Box plots are shown, each overlaid circle represents the average of the measurements for each embryo. (n = 7 eyes from 6 embryos per group) P value (Mann‐Whitney U test) is shown. Results indicate that time from PtdSer exposure to microglial clearance is increased in the presence of PSB‐0739