FIGURE SUMMARY
Title

Chemokine receptor trafficking coordinates neutrophil clustering and dispersal at wounds in zebrafish

Authors
Coombs, C., Georgantzoglou, A., Walker, H.A., Patt, J., Merten, N., Poplimont, H., Busch-Nentwich, E.M., Williams, S., Kotsi, C., Kostenis, E., Sarris, M.
Source
Full text @ Nat. Commun.

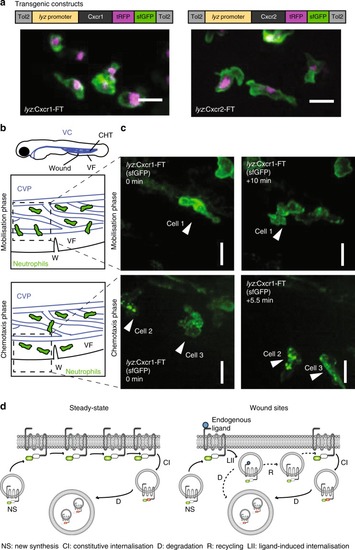
Live imaging of chemokine receptor trafficking in neutrophils. a Constructs used for neutrophil-specific transgenic expression of Cxcr1-FT (Fluorescent Timer) and Cxcr2-FT. Confocal projections of neutrophils in the head of a 3 days post fertilization (dpf) transgenic larva (Tg(lyz:Cxcr1-FT), top; Tg(lyz:Cxcr2-FT), bottom) showing tRFP (tagRFP; magenta) and sfGFP (green) channels. Scale bar = 20 µm. b Anatomical scheme of 3 dpf larva showing the location of the caudal hematopoietic tissue (CHT), the venus circulation (VC, blue), the ventral fin (VF), and the wound site. Below the larva are schemes depicting the area of the wound (W) with neutrophils getting mobilized from the CHT (top) or performing chemotaxis upon entering the ventral fin (bottom). The Caudal Vein plexus (CVP) of the CHT tissue is drawn in blue. Dashed square indicates area imaged in snapshots on the right. c Neutrophils in Tg(lyz:Cxcr1-FT) larvae (sfGFP is shown) upon mobilization from the CHT (top panels) or chemotaxis towards the wound (bottom panels). Arrows show the same cells over time. Time points on the right image are minutes elapsed after image on the left. Scale bar = 10 µm. d Schematic of Cxcr1/2-FT construct behavior in neutrophils. Newly synthesized receptors fluoresce in green due to short residence time at the plasma membrane. Older receptors fluoresce in red and green, and accumulate in intracellular compartments through constitutive turnover. Upon exposure to ligands at wounds, the receptor may internalize and subsequently be degraded or recycled

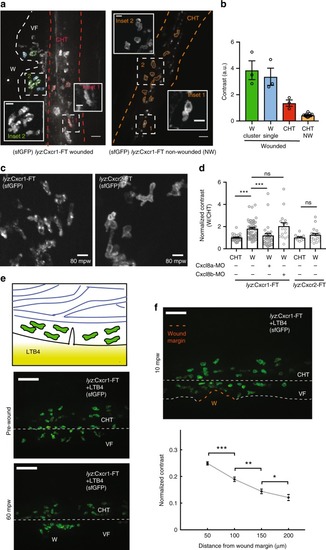
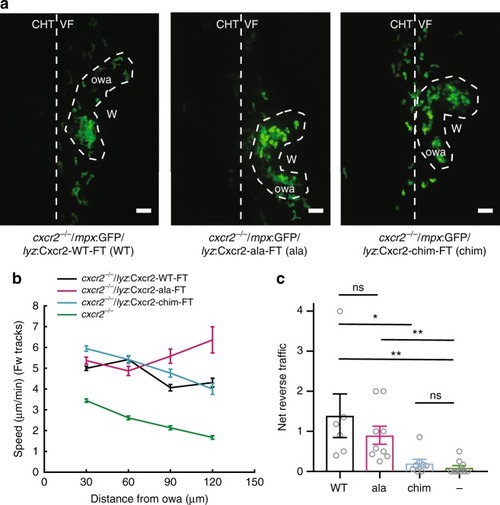
Distinct trafficking of Cxcr1 and Cxcr2 during neutrophil migration to wounds. a Overview of receptor distribution patterns and corresponding quantitative approach. Confocal projection of neutrophils in a representative wounded or unwounded Tg(lyz:Cxcr1-FT) larva. Examples of cells are shown in different colors: single (blue) or clustered (green) cells at the wound, cells in the CHT of the same wounded larva (red) or cells in the CHT of an unwounded larva (orange). CHT: caudal hematopoietic tissue, VF: ventral fin, W: wound. b Calculation of contrast from the cells segmented in a. n = 3 (green, blue, red), n = 11 (orange) cells. Scale bar = 25 µm, scale bar (insets) = 10 µm. c Confocal projection of neutrophils in Tg(lyz:Cxcr1-FT) or Tg(lyz:Cxcr2-FT) larvae at the wound focus. Scale bar = 10 µm. mpw = minutes post wound. d Normalized contrast (contrast per individual neutrophil normalized to the mean contrast of non-mobilized cells in the CHT). Cxcl8a refers to injection of a splice-blocking together with a translation-blocking morpholino for cxcl8a. cxcl8b refers to injection with a splice-blocking morpholino for Cxcl8b. For Tg(lyz:Cxcr1-FT): n = 24 cells (CHT), n = 47 cells (wound) from 8 larvae. For Tg(lyz:Cxcr1-FT) with morpholinos: n = 28 cells (Cxcl8a-MO) from 5 larvae, n = 16 cells (Cxcl8b-MO) from 5 larvae. For Tg(lyz:Cxcr2-FT): n = 10 cells (CHT) and n = 20 cells (wound) from 3 larvae. Data were pooled from independent larvae acquired in 1 to 5 imaging sessions. Kruskal–Wallis test with Dunn’s multiple comparisons test for Tg(lyz:Cxcr1-FT), two-tailed unpaired Mann–Whitney test for Tg(lyz:Cxcr2-FT). e Top: cartoon depicting neutrophils in the CHT after mobilization to the ventral fin in response to an exogenous LTB4 gradient. Bottom: confocal projections of Cxcr1-FT neutrophils 30 min after LTB4 addition, right before (middle) and 1 h after wound (bottom). Scale bar = 50 µm. f Same larva as in e, at 10 mpw. Orange dashed line shows the wound margin. Graph below shows normalized contrast of individual neutrophils as a function of distance from the nearest point in the wound margin. For normalization, values were divided by the maximum contrast of each movie. n > 92 cells or clustered cells per bin, from 3 larvae in 3 imaging sessions. Two-tailed unpaired Mann–Whitney test. Error bars represent S.E.M. across cells. Source data are provided as a Source Data file

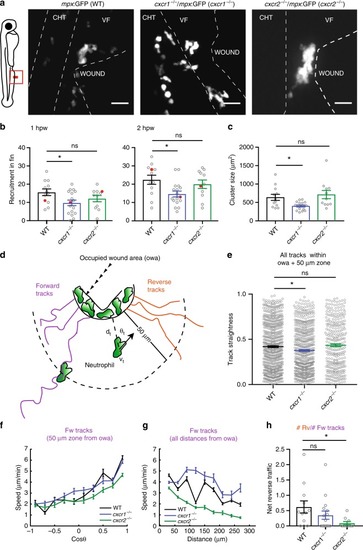
Differential contributions of Cxcr1 and Cxcr2 in neutrophil clustering and dispersal. a Confocal projections showing distribution of neutrophils at wounds of wild-type (WT) Tg(mpx:GFP)i114, cxcr1−/− (cxcr1−/−/Tg(mpx:GFP)i114), or cxcr2−/− (cxcr2−/−/Tg(mpx:GFP)i114) larvae at 2 hpw. CHT: caudal hematopoietic tissue, VF: ventral fin. Cartoon on the left indicates area imaged. Dashed lines show VF and CHT outlines. Scale bar = 25 µm. b Number of recruited neutrophils at 1 and 2 hpw, within a square area of 200 × 200 µm around the wound. One-way ANOVA with Tukeyʼs multiple comparisons test. n = 12 (WT), n = 17 (cxcr1−/−), and n = 11 (cxcr2−/−) larvae. Larvae shown in a are represented with a red dot. c Average neutrophil cluster size per larva. n = 12 (WT), n = 17 (cxcr1−/−), and n = 11 (cxcr2−/−) larvae. Kruskal–Wallis test with Dunn’s multiple comparisons test. d Cartoon depicting trajectory parameters measured. The occupied wound area (owa) is the area occupied by the neutrophil cluster. Forward (magenta) and reverse (orange) segments of cell trajectories are defined as the path of neutrophils prior to entering and after leaving the owa, respectively. dt, shortest distance from owa at time point t. vt, speed at time point t. θt = approach angle to owa at time point t. e Neutrophil track straightness within the owa and an area extending 50 µm beyond. n = 680 tracks (WT), n = 603 tracks (cxcr1−/−), and n = 319 tracks (cxcr2−/−). Kruskal–Wallis test with Dunn’s multiple comparisons test. f Neutrophil speed in relation to the cosine of the angle θ, within a zone of 0–50 µm from the owa are shown. n = 131–2423 steps per bin (WT), n = 11–3008 steps per bin (cxcr1−/−), n = 88–2823 steps per bin (cxcr2−/−). g Neutrophil speed in relation to distance from the owa. n = 133–1227 cell steps per bin (WT), n = 231–1436 steps per bin (cxcr1−/−), n = 202–1382 steps per bin (cxcr2−/−). h Net reverse traffic. n = 12 (WT), n = 17 (cxcr1−/−), and n = 11 (cxcr2−/−) larvae. In all panels, data are from the same 12 WT, 17 cxcr1−/−, and 11 cxcr2−/− larvae from 6, 10, and 8 imaging sessions, respectively. Cells were analyzed from the start of the movie (~15 mpw) up to 2 hpw. Error bars represent S.E.M. across cell steps (f,g) or cell tracks (e) or larvae (b,c,h). Source data are provided as a Source Data file

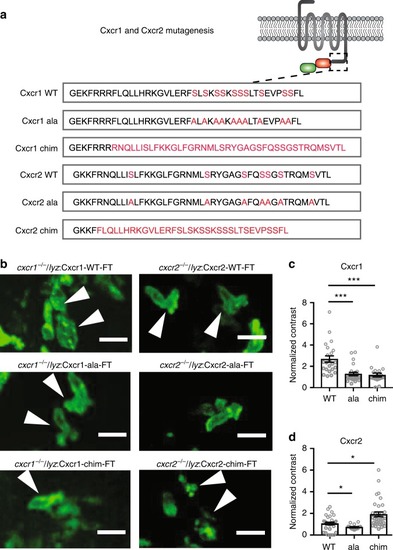
Receptor mutagenesis alters Cxcr1 and Cxcr2 trafficking. a Mutagenesis of Cxcr1. Amino acid sequence of the C-terminus is shown with candidate phosphorylation targets (serines) or transplanted sequences highlighted in red. b Neutrophils in cxcr1−/−/cxcr2−/− larvae rescued by transgenic neutrophil-specific expression of Cxcr1-FT/Cxcr2-FT, Cxcr1-ala-FT/Cxcr2-ala-FT, or Cxcr1-chim-FT/Cxcr2-chim-FT receptors. Arrows point to neutrophils at the center of the wound, with representative distribution of the receptor. Scale bar = 15 µm. c Quantification of contrast in cxcr1−/− or cxcr1−/+ neutrophils rescued by the different Cxcr1-FT receptor variants. n = 23 cells (WT) from 7 larvae, n = 26 cells (ala) from 6 larvae, n = 19 cells (chim) from 5 larvae. Data were acquired in 2 to 4 imaging sessions. Kruskal–Wallis test with Dunn’s multiple comparisons test. d Quantification of contrast in cxcr2−/− neutrophils rescued by the different Cxcr1-FT receptor variants. n = 33 cells (WT) from 5 larvae, n = 18 cells (ala) from 5 larvae, n = 33 cells (chim) from 8 larvae. Data are from independent larvae in 3 to 5 imaging sessions. Kruskal–Wallis test with Dunn’s multiple comparisons test. Error bars represent S.E.M. across cells. Source data are provided as a Source Data file

Plasma membrane sustenance of Cxcr2 is required for neutrophil dispersal. a Confocal projections of neutrophil distribution in Tg(lyz:Cxcr2-WT-FT)/cxcr2−/− larvae, Tg(lyz:Cxcr2-ala-FT)/cxcr2−/−, and Tg(lyz:Cxcr2-chim-FT)/cxcr2−/− at ~2 hpw. Dashed line indicates occupied wound area (owa). CHT: caudal hematopoietic tissue, VF: ventral fin, W: wound. Scale bar = 32 µm. b Neutrophil speed in relation to distance from the owa. Average speeds per cell per distance bin are shown. n = 558–2651 steps per bin (WT), n = 95–1266 steps per bin (ala), n = 494–2000 steps per bin (chim), and n = 1168–2823 steps per bin for (cxcr2−/−). c Net reverse traffic. n = 6 (WT), n = 9 (ala), n = 8 (chim), n = 11 (−; cxcr2−/−) larvae. Kruskal–Wallis test with Dunn’s multiple comparisons test. In b and c, data are from 6 (WT), 9 (ala), 8 (chim), and 11 (−; cxcr2−/−) larvae from 3, 4, 3, and 8 imaging sessions, respectively. Cells were analyzed from the start of the movie (~15 mpw) up to 2 hpw. Error bars represent S.E.M. across cell steps (b) or larvae (c). Source data are provided as a Source Data file

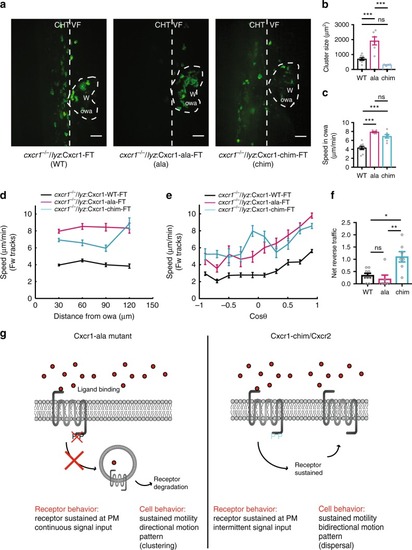
Receptor internalization limits neutrophil motion at wounds. a Confocal projections of neutrophil distribution in Tg(lyz:Cxcr1-WT-FT)/cxcr1−/− larvae (WT), Tg(lyz:Cxcr1-ala-FT)/cxcr1−/− (ala), Tg(lyz:Cxcr1-chim-FT)/cxcr1−/−(chim) at ~2 hpw. Dashed line indicates occupied wound area (owa). CHT: caudal hematopoietic tissue, VF: ventral fin, W: wound. Scale bar = 32 µm. b Quantification of neutrophil cluster size, n = 8 (WT), n = 6 (ala), and n = 4 (chim) larvae from 3 imaging sessions per condition. One-way ANOVA test with Tukeyʼs multiple comparisons test. c Quantification of speed within the owa. n = 9 (WT), n = 6 (ala), and n = 7 (chim) larvae. One-way ANOVA test with Tukeyʼs multiple comparisons test. d Neutrophil speed in relation to distance from the owa. Average speeds per cell step per distance bin are shown. n = 316–1942 steps per bin (WT), n = 105–706 steps per bin (ala), n = 83–896 steps per bin (chim). e Neutrophil speed in relation to cosine of angle θ. Average speeds per cell per cosθ bin are shown. n = 128–849 steps per bin (WT), n = 22–445 steps per bin (ala), and n = 44–417 steps per bin (chim). f Net reverse traffic. n = 9 (WT), n = 6 (ala), and N = 7 (chim) larvae. Kruskal–Wallis test with Dunn’s multiple comparisons test. g Summary of phenotypes observed in Cxcr1 rescue experiments and their interpretation. PM, plasma membrane. For cf, data are from 9 (WT), 6 (ala), and 7 (chim) larvae from 3, 6, and 3 imaging sessions, respectively. For all panels, analysis was focused on the post initial arrival window of 1–2 hpw. Error bars represent S.E.M. across cell steps (d,e) or larvae (b,c,f). Source data are provided as a Source Data file

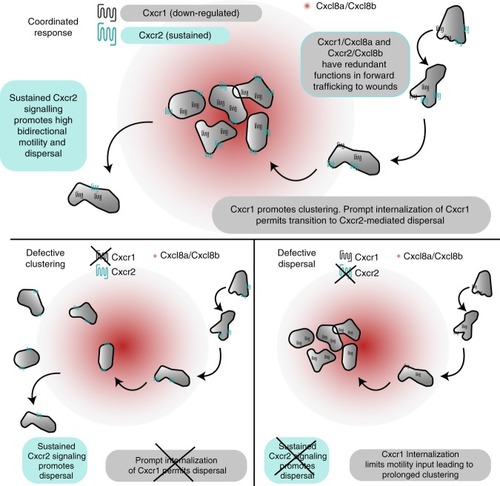
Model for coordination of neutrophil clustering and dispersal through chemokine receptor trafficking. (Top) Cxcr1/Cxcl8a and Cxcr2/Cxcl8b can partly compensate for each other during initial chemotaxis to the wounded tissue. However, Cxcr1 specifically promotes clustering and this contribution is limited by desensitization and downregulation. Conversely, Cxcr2 is recycled after internalization and promotes persistent bidirectional motility in the wounded tissue through sustained, intermittent signaling. This facilitates dispersal from the site. Bottom left: in the absence of Cxcr1, neutrophils are recruited, through Cxcr2/Cxcl8b and other endogenous signals, but show a loss in clustering. Bottom right: in the absence of Cxcr2, neutrophils are recruited, through Cxcr1/Cxcl8a and other endogenous signals. Once at the target, Cxcr1 is maximally downregulated and neutrophils lack signal input for motility, leading to a defect in dispersal

Acknowledgments
This image is the copyrighted work of the attributed author or publisher, and ZFIN has permission only to display this image to its users. Additional permissions should be obtained from the applicable author or publisher of the image. Full text @ Nat. Commun.