IMAGE

Fig. 4

ID
ZDB-IMAGE-191230-710
Source
Figures for Coombs et al., 2019
Image
Figure Caption

Fig. 4

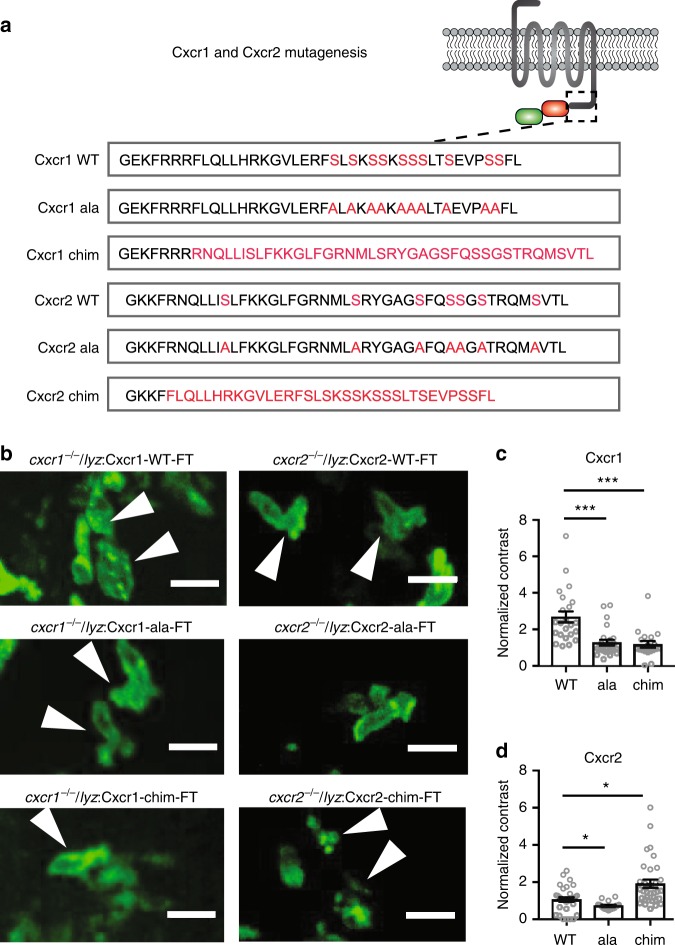
Receptor mutagenesis alters Cxcr1 and Cxcr2 trafficking. a Mutagenesis of Cxcr1. Amino acid sequence of the C-terminus is shown with candidate phosphorylation targets (serines) or transplanted sequences highlighted in red. b Neutrophils in cxcr1−/−/cxcr2−/− larvae rescued by transgenic neutrophil-specific expression of Cxcr1-FT/Cxcr2-FT, Cxcr1-ala-FT/Cxcr2-ala-FT, or Cxcr1-chim-FT/Cxcr2-chim-FT receptors. Arrows point to neutrophils at the center of the wound, with representative distribution of the receptor. Scale bar = 15 µm. c Quantification of contrast in cxcr1−/− or cxcr1−/+ neutrophils rescued by the different Cxcr1-FT receptor variants. n = 23 cells (WT) from 7 larvae, n = 26 cells (ala) from 6 larvae, n = 19 cells (chim) from 5 larvae. Data were acquired in 2 to 4 imaging sessions. Kruskal–Wallis test with Dunn’s multiple comparisons test. d Quantification of contrast in cxcr2−/− neutrophils rescued by the different Cxcr1-FT receptor variants. n = 33 cells (WT) from 5 larvae, n = 18 cells (ala) from 5 larvae, n = 33 cells (chim) from 8 larvae. Data are from independent larvae in 3 to 5 imaging sessions. Kruskal–Wallis test with Dunn’s multiple comparisons test. Error bars represent S.E.M. across cells. Source data are provided as a Source Data file

Acknowledgments
This image is the copyrighted work of the attributed author or publisher, and ZFIN has permission only to display this image to its users. Additional permissions should be obtained from the applicable author or publisher of the image. Full text @ Nat. Commun.