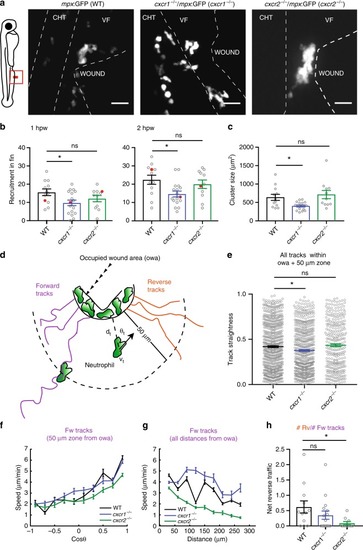
Differential contributions of Cxcr1 and Cxcr2 in neutrophil clustering and dispersal. a Confocal projections showing distribution of neutrophils at wounds of wild-type (WT) Tg(mpx:GFP)i114, cxcr1−/− (cxcr1−/−/Tg(mpx:GFP)i114), or cxcr2−/− (cxcr2−/−/Tg(mpx:GFP)i114) larvae at 2 hpw. CHT: caudal hematopoietic tissue, VF: ventral fin. Cartoon on the left indicates area imaged. Dashed lines show VF and CHT outlines. Scale bar = 25 µm. b Number of recruited neutrophils at 1 and 2 hpw, within a square area of 200 × 200 µm around the wound. One-way ANOVA with Tukeyʼs multiple comparisons test. n = 12 (WT), n = 17 (cxcr1−/−), and n = 11 (cxcr2−/−) larvae. Larvae shown in a are represented with a red dot. c Average neutrophil cluster size per larva. n = 12 (WT), n = 17 (cxcr1−/−), and n = 11 (cxcr2−/−) larvae. Kruskal–Wallis test with Dunn’s multiple comparisons test. d Cartoon depicting trajectory parameters measured. The occupied wound area (owa) is the area occupied by the neutrophil cluster. Forward (magenta) and reverse (orange) segments of cell trajectories are defined as the path of neutrophils prior to entering and after leaving the owa, respectively. dt, shortest distance from owa at time point t. vt, speed at time point t. θt = approach angle to owa at time point t. e Neutrophil track straightness within the owa and an area extending 50 µm beyond. n = 680 tracks (WT), n = 603 tracks (cxcr1−/−), and n = 319 tracks (cxcr2−/−). Kruskal–Wallis test with Dunn’s multiple comparisons test. f Neutrophil speed in relation to the cosine of the angle θ, within a zone of 0–50 µm from the owa are shown. n = 131–2423 steps per bin (WT), n = 11–3008 steps per bin (cxcr1−/−), n = 88–2823 steps per bin (cxcr2−/−). g Neutrophil speed in relation to distance from the owa. n = 133–1227 cell steps per bin (WT), n = 231–1436 steps per bin (cxcr1−/−), n = 202–1382 steps per bin (cxcr2−/−). h Net reverse traffic. n = 12 (WT), n = 17 (cxcr1−/−), and n = 11 (cxcr2−/−) larvae. In all panels, data are from the same 12 WT, 17 cxcr1−/−, and 11 cxcr2−/− larvae from 6, 10, and 8 imaging sessions, respectively. Cells were analyzed from the start of the movie (~15 mpw) up to 2 hpw. Error bars represent S.E.M. across cell steps (f,g) or cell tracks (e) or larvae (b,c,h). Source data are provided as a Source Data file
|
