IMAGE

Fig. 2

ID
ZDB-IMAGE-191230-708
Source
Figures for Coombs et al., 2019
Image
Figure Caption

Fig. 2

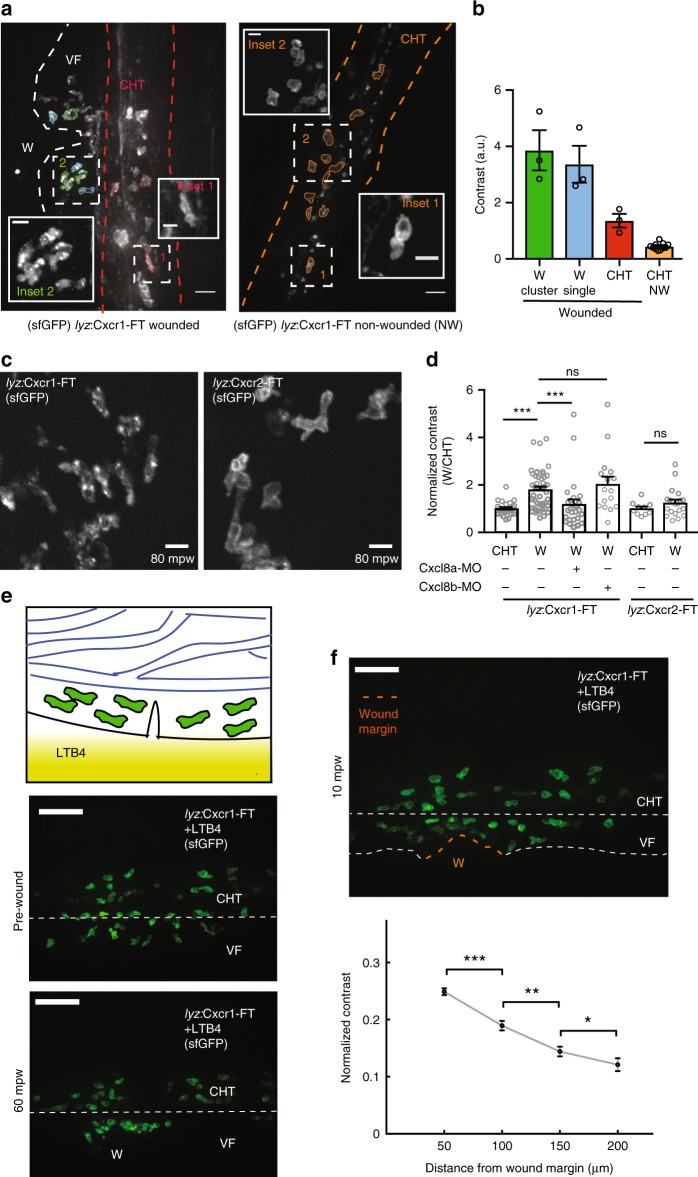
Distinct trafficking of Cxcr1 and Cxcr2 during neutrophil migration to wounds. a Overview of receptor distribution patterns and corresponding quantitative approach. Confocal projection of neutrophils in a representative wounded or unwounded Tg(lyz:Cxcr1-FT) larva. Examples of cells are shown in different colors: single (blue) or clustered (green) cells at the wound, cells in the CHT of the same wounded larva (red) or cells in the CHT of an unwounded larva (orange). CHT: caudal hematopoietic tissue, VF: ventral fin, W: wound. b Calculation of contrast from the cells segmented in a. n = 3 (green, blue, red), n = 11 (orange) cells. Scale bar = 25 µm, scale bar (insets) = 10 µm. c Confocal projection of neutrophils in Tg(lyz:Cxcr1-FT) or Tg(lyz:Cxcr2-FT) larvae at the wound focus. Scale bar = 10 µm. mpw = minutes post wound. d Normalized contrast (contrast per individual neutrophil normalized to the mean contrast of non-mobilized cells in the CHT). Cxcl8a refers to injection of a splice-blocking together with a translation-blocking morpholino for cxcl8a. cxcl8b refers to injection with a splice-blocking morpholino for Cxcl8b. For Tg(lyz:Cxcr1-FT): n = 24 cells (CHT), n = 47 cells (wound) from 8 larvae. For Tg(lyz:Cxcr1-FT) with morpholinos: n = 28 cells (Cxcl8a-MO) from 5 larvae, n = 16 cells (Cxcl8b-MO) from 5 larvae. For Tg(lyz:Cxcr2-FT): n = 10 cells (CHT) and n = 20 cells (wound) from 3 larvae. Data were pooled from independent larvae acquired in 1 to 5 imaging sessions. Kruskal–Wallis test with Dunn’s multiple comparisons test for Tg(lyz:Cxcr1-FT), two-tailed unpaired Mann–Whitney test for Tg(lyz:Cxcr2-FT). e Top: cartoon depicting neutrophils in the CHT after mobilization to the ventral fin in response to an exogenous LTB4 gradient. Bottom: confocal projections of Cxcr1-FT neutrophils 30 min after LTB4 addition, right before (middle) and 1 h after wound (bottom). Scale bar = 50 µm. f Same larva as in e, at 10 mpw. Orange dashed line shows the wound margin. Graph below shows normalized contrast of individual neutrophils as a function of distance from the nearest point in the wound margin. For normalization, values were divided by the maximum contrast of each movie. n > 92 cells or clustered cells per bin, from 3 larvae in 3 imaging sessions. Two-tailed unpaired Mann–Whitney test. Error bars represent S.E.M. across cells. Source data are provided as a Source Data file

Figure Data
Acknowledgments
This image is the copyrighted work of the attributed author or publisher, and ZFIN has permission only to display this image to its users. Additional permissions should be obtained from the applicable author or publisher of the image. Full text @ Nat. Commun.