
- Title
-
Endocrine and local signaling interact to regulate spermatogenesis in zebrafish: Follicle-stimulating hormone, retinoic acid and androgens
- Authors
- Crespo, D., Assis, L.H.C., van de Kant, H.J.G., de Waard, S., Safian, D., Lemos, M.S., Bogerd, J., Schulz, R.W.
- Source
- Full text @ Development
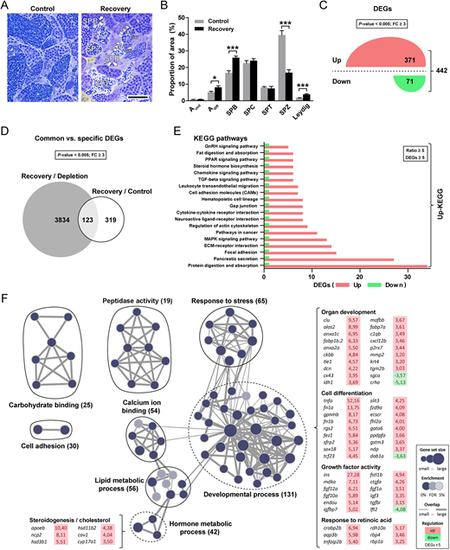
Morphometric and transcriptomic analyses of zebrafish testis during spermatogenic recovery from a cytotoxic (busulfan) insult. (A,B) Qualitative (A) and quantitative (B) evaluation of the recovery of different germ and somatic cell types when compared with untreated control testes. Aund, type A undifferentiated spermatogonia; Adiff, type A differentiating spermatogonia (arrowheads); SPB, type B spermatogonia (arrows); SPC, spermatocytes; SPT, spermatids; SPZ, spermatozoa (dashed line); Leydig, Leydig cells (yellow background, including other interstitial cells). Data are mean±s.e.m. (n=5; *P<0.05, ***P<0.001). Scale bar: 25 µm. (C) Up (red)- and down (green)-regulated genes identified by RNAseq at the beginning of the recovery period (n=5, P<0.005, fold change [FC]≥3.0). (D) Common and specific recovery-associated genes retrieved when tested against the depleted (gray set) and control (white set) testis transcriptomes. (E) KEGG pathways modulated in recovering testes. Each pathway is highlighted in red (up-) or green (downregulated). (F) Functional enrichment of recovery-induced gene expression. Groups of closely related GO terms are encircled and labeled (numbers of regulated genes are shown). The groups labeled as ‘developmental process’ and ‘hormone metabolic process’ are outlined with dashed lines and examples of identified DEGs in those sets are shown. |
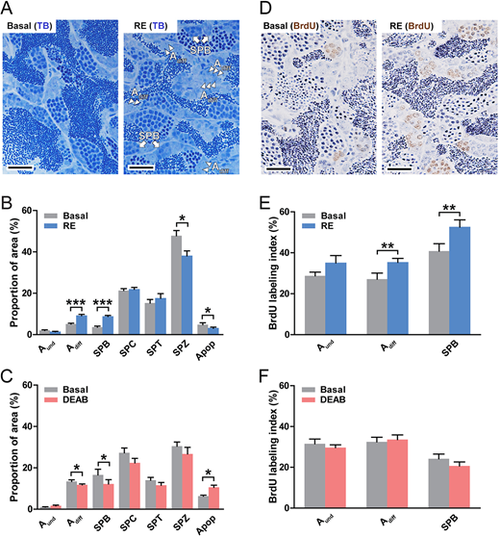
Retinoid effects on spermatogonial development. (A-F) Evaluation of the proportions of different germ cells (A-C) and of the proliferation activity of spermatogonia (D-F) in testes cultured for 4 days under different experimental conditions: in the absence or presence of retinol (RE, 10 µM; A,B and D,E), and in the absence or presence of DEAB (10 µM; C,F). Adiff are indicated by arrowheads, SPB by arrows in A; Apop, apoptotic cells. Data are mean±s.e.m. (n=6; *P<0.05, **P<0.01, ***P<0.001). Scale bars: 25 µm. |
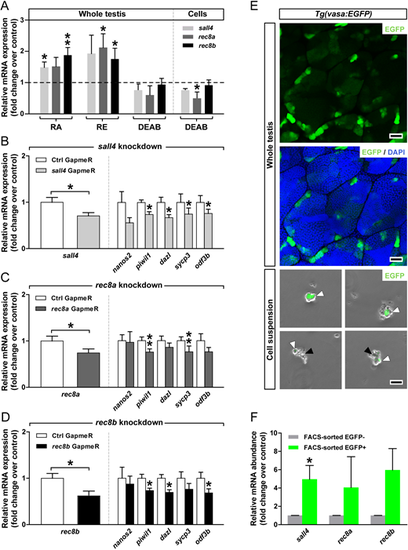
Involvement of sall4, rec8a and rec8b in mediating RA effects in the zebrafish testis. (A) Modulation of sall4, rec8a and rec8b mRNA levels in response to retinoids. Testicular explants were cultured for 4 days with RA, RE or DEAB (each at 10 µM). Data are mean fold change±s.e.m. (n=6-15; *P<0.05, **P<0.01) and are shown relative to the control condition, which is set at 1 (dashed line). DEAB effects were also tested using testicular cell suspensions cultured for 3 days in the absence or presence of 10 µM DEAB (n=3, technical replicates; *P<0.05). (B-D) Effects of GapmeR (1 µM)-mediated knockdown of sall4, rec8 or rec8b after 4 days of tissue culture, on the targeted and selected germ cell-marker genes. Data are mean fold change±s.e.m. (n=3, technical replicates; *P<0.05, **P<0.01) and are normalized to the GapmeR control (Ctrl), which is set at 1. (E) A pooled testicular cell suspension was obtained from 20 Tg(vasa:EGFP) testes and subjected to FACS. Black and white arrowheads indicate EGFP− and EGFP+ cells, respectively. Localization of the vasa:EGFP signal by CLSM in a whole-mount preparation of adult testis shows preferential expression of EGFP in single germ cells and in small germ cell groups, demonstrating expression in type Aund and Adiff spermatogonia. (F) Relative mRNA expression of sall4, rec8a and rec8b in FACS-sorted fractions. Data are shown as mean fold change±s.e.m. (n=3, technical replicates; *P<0.05) and are expressed relative to the EGFP− condition, which is set at 1. Scale bars: 25 μm. |

Inactivation of retinoid signaling in germ cells results in severe testicular defects. (A) Confirmation of transgenesis 3 days post-fertilization in zebrafish larvae microinjected as 1-cell stage embryos. EGFP and mCherry expression was detected in the heart (arrows) and genital ridge (broken lines) of dn-raraa larvae, respectively. Scale bars: 200 μm in i,ii; 50 μm in iii. (B-D) Qualitative (B) and quantitative (C,D) analysis of spermatogenesis (C) and gonadosomatic (D) indices of wild-type and dn-raraa males 6 and 9 months post-fertilization (data are mean±s.e.m.; n=3-5; *P<0.05, **P<0.01). Scale bars: 25 µm. Red asterisks indicate germ cell-depleted tissue; black asterisk indicates an empty area. Myoid, myoid cells; others, germ cell-depleted tissue plus empty areas. In Bix-xi, detection of germ cell apoptosis/DNA damage by TUNEL analysis is presented. TUNEL+ cells/cysts are shown in green and PI (propidium iodide) counterstain is in red. Arrowheads indicate isolated TUNEL+ cells among spermatozoa in the tubular lumen; representative spermatid cysts containing several TUNEL+ cells are encircled with a dashed line. Scale bars: 25 µm. (E) Fertilization rate (gray bars) and embryo survival of fertilized eggs (black bars) from adult wild-type and dn-raraa transgenic males. Mating was repeated every 7-14 days (data are mean±s.e.m.; n=4-6; **P<0.01, ***P<0.001), and fertilization and survival recorded 2 and 24 h post-fertilization (hpf), respectively. (F) qPCR quantification of RA-related gene and raraaDN391 transgene transcripts in 6- and 9-month-old wild-type and dn-raraa testicular samples. Data are mean fold-change±s.e.m. (n=3 or 4; *P<0.05, **P<0.01) and are expressed relative to the wild-type group, which is set at 1. (G) Transcript levels of steroidogenesis-related (star, hsd3b1, cyp17a1 and ar), Leydig cell (insl3) and myoid cell (tagln) genes in wild-type and dn-raraa transgenic adult testes. Data are shown as mean fold-change±s.e.m. (n=3 or 4; *P<0.05, **P<0.01) and are expressed relative to the wild-type group, which is set at 1 (dashed line). (H) 11-KT plasma levels from 6- and 9-month-old wild-type and dn-raraa males. Data are mean fold change±s.e.m. (n=3 or 4; *P<0.05). |
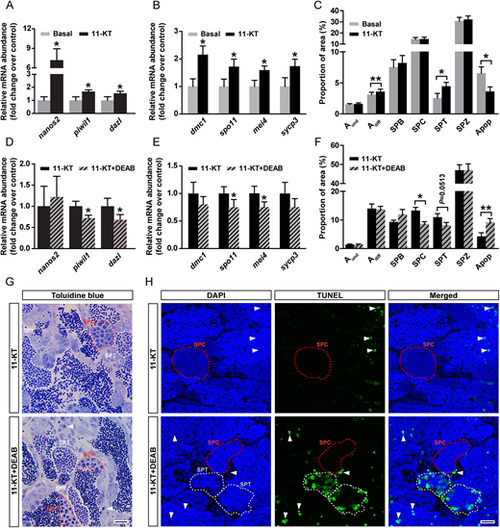
Retinoid involvement in androgen-stimulated spermatogenesis. (A-C) Transcript levels of selected spermatogonial (A) and meiotic (B) markers, and the frequency of different germ cell types and apoptotic cells (C) in testes incubated for 4 days in basal conditions or with 200 nM 11-KT. Data are mean fold change±s.e.m. (n=8; *P<0.05, **P<0.01) and are expressed relative to the respective control condition, which is set at 1. (D-F) Transcript levels of germ cell-marker genes (D,E) and frequency of different germ cell types and apoptotic cells (F) in testes incubated for 4 days with 200 nM 11-KT, in the absence or presence of DEAB (10 µM). Data are mean±s.e.m. (n=7 or 8; *P<0.05, **P<0.01). (G) Germ cell apoptosis in testicular explants incubated with 11-KT in the absence or presence of DEAB. Arrowheads indicate isolated DNA damage/apoptotic cells and representative spermatocyte or spermatid cysts are encircled with a red or white dashed line, respectively. (H) Detection of germ cell DNA damage/apoptosis by TUNEL analysis. TUNEL+ cells/cysts are shown in green and DAPI counterstain is blue. Arrowheads indicate isolated TUNEL+ cells and representative spermatocyte or spermatid (TUNEL+ or TUNEL−) cysts are encircled with a red or white dashed line, respectively. Scale bars: 15 µm in G; 10 µm in H. |
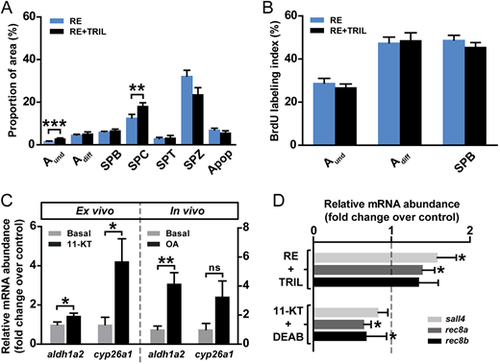
The influence of steroids on the regulation of retinoid-modulated spermatogenesis. (A,B) Frequency of germ cell types and apoptotic cells (A) and BrdU labeling indices (B) in testicular explants cultured for 4 days in the presence of 10 µM RE or plus 25 µg/ml trilostane (TRIL). Data are mean±s.e.m. (n=6; **P<0.01, ***P<0.001). (C) Ex vivo and in vivo androgen effects on aldh1a2 and cyp26a1 expression. In the left panel, testis tissue was cultured for 4 days to study the effects of 11-KT (200 nM) on the mRNA abundance of RA-related enzymes compared with the control group. In the right panel, adult zebrafish males were exposed to 100 nM OA in vivo for 5 weeks. Data are expressed as fold change±s.e.m. (n=7 or 8; *P<0.05, **P<0.01) and shown relative to the control condition, which is set at 1. ns, no significant difference. (D) RA target gene expression in testicular explants cultured for 4 days under RE (10 µM)-stimulated conditions, in the absence or presence of 25 µg/ml TRIL, or under 11-KT (200 nM)-stimulated conditions, in the absence or presence of 10 µM DEAB. Data are mean fold change±s.e.m. (n=7-12; *P<0.05) and are shown as relative to the control condition (RE- and 11-KT-induced levels, respectively), which is set at 1 (dashed line). |
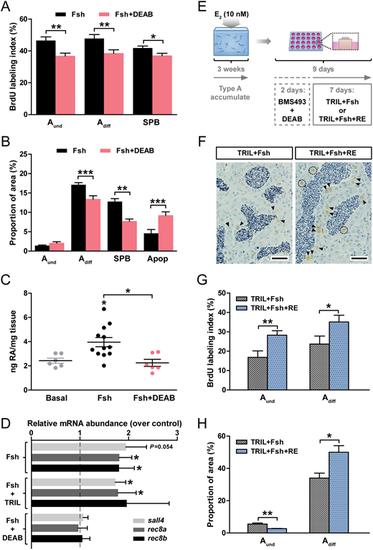
RA signaling contributes to Fsh-stimulated spermatogonial differentiation. Determination of BrdU labeling indices (A) and of the frequency (B) of type A and B spermatogonia and apoptotic cells. Testicular explants were cultured for 4 days under Fsh-stimulated (100 ng/ml) conditions, in the absence or presence of 10 µM DEAB. (C) Quantification of RA production by testis tissue cultured for 4 days in response to basal medium, 100 ng/ml Fsh alone or with 10 µM DEAB. (D) Expression of RA target genes in testicular explants cultured for 4 days under Fsh-stimulated (100 ng/ml) conditions, in the absence or presence of 25 µg/ml TRIL or of 10 µM DEAB. (E-H) Retinoid signaling directly stimulates spermatogonial proliferation during spermatogenetic recovery. (E) Testis tissue was collected from adult males exposed to 10 nM estradiol (E2) in vivo for 21 days and then cultured for 2 days in the presence of BMS493 (10 µM) and DEAB (10 µM) inhibitors, followed by another 7 days incubation with different treatments (25 µg/ml TRIL plus 100 ng/ml Fsh) in the absence or presence of 10 µM RE. (F-H) Detection of BrdU (F) and quantification of BrdU labeling indices (G) and the areas occupied by type A spermatogonia (H). Data are expressed as mean±s.e.m. (n=5-12; *P<0.05, **P<0.01, ***P<0.001). In D, results are shown as relative to the basal control condition, which is set at 1 (dashed line). Scale bars: 25 µm in F. BrdU-positive Aund cells are indicated by dashed black lines, Adiff by arrowheads. |

Proposed intratesticular feedback loop to prevent testis hypertrophy in adult zebrafish via RA-mediated inhibition of androgen production. Schematic illustration of the intratesticular feedback of RA signaling in germ cells reducing androgen production, and the main stages of zebrafish spermatogenesis affected by RA (orange) and/or androgens (green), both of which are regulated by Fsh (black). The shaded areas surrounding germ cells represent Sertoli cell cytoplasm containing orange nuclei with nucleoli. |