
|
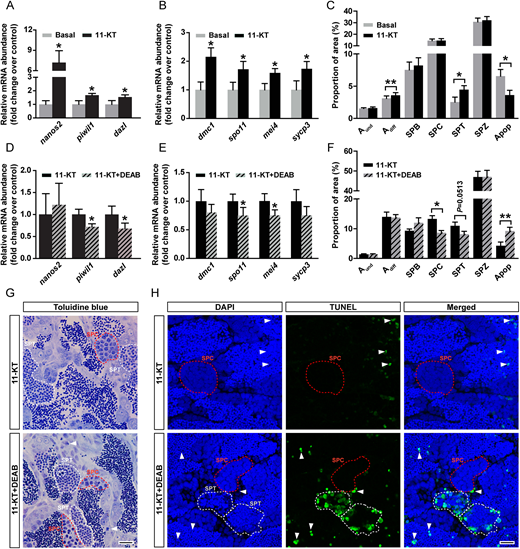
Fig. 5 Retinoid involvement in androgen-stimulated spermatogenesis. (A-C) Transcript levels of selected spermatogonial (A) and meiotic (B) markers, and the frequency of different germ cell types and apoptotic cells (C) in testes incubated for 4 days in basal conditions or with 200 nM 11-KT. Data are mean fold change±s.e.m. (n=8; *P<0.05, **P<0.01) and are expressed relative to the respective control condition, which is set at 1. (D-F) Transcript levels of germ cell-marker genes (D,E) and frequency of different germ cell types and apoptotic cells (F) in testes incubated for 4 days with 200 nM 11-KT, in the absence or presence of DEAB (10 µM). Data are mean±s.e.m. (n=7 or 8; *P<0.05, **P<0.01). (G) Germ cell apoptosis in testicular explants incubated with 11-KT in the absence or presence of DEAB. Arrowheads indicate isolated DNA damage/apoptotic cells and representative spermatocyte or spermatid cysts are encircled with a red or white dashed line, respectively. (H) Detection of germ cell DNA damage/apoptosis by TUNEL analysis. TUNEL+ cells/cysts are shown in green and DAPI counterstain is blue. Arrowheads indicate isolated TUNEL+ cells and representative spermatocyte or spermatid (TUNEL+ or TUNEL−) cysts are encircled with a red or white dashed line, respectively. Scale bars: 15 µm in G; 10 µm in H.