
|
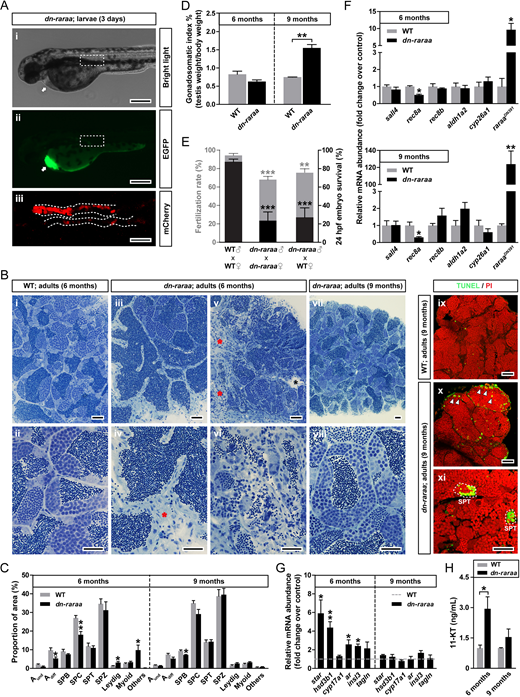
Fig. 4 Inactivation of retinoid signaling in germ cells results in severe testicular defects. (A) Confirmation of transgenesis 3 days post-fertilization in zebrafish larvae microinjected as 1-cell stage embryos. EGFP and mCherry expression was detected in the heart (arrows) and genital ridge (broken lines) of dn-raraa larvae, respectively. Scale bars: 200 μm in i,ii; 50 μm in iii. (B-D) Qualitative (B) and quantitative (C,D) analysis of spermatogenesis (C) and gonadosomatic (D) indices of wild-type and dn-raraa males 6 and 9 months post-fertilization (data are mean±s.e.m.; n=3-5; *P<0.05, **P<0.01). Scale bars: 25 µm. Red asterisks indicate germ cell-depleted tissue; black asterisk indicates an empty area. Myoid, myoid cells; others, germ cell-depleted tissue plus empty areas. In Bix-xi, detection of germ cell apoptosis/DNA damage by TUNEL analysis is presented. TUNEL+ cells/cysts are shown in green and PI (propidium iodide) counterstain is in red. Arrowheads indicate isolated TUNEL+ cells among spermatozoa in the tubular lumen; representative spermatid cysts containing several TUNEL+ cells are encircled with a dashed line. Scale bars: 25 µm. (E) Fertilization rate (gray bars) and embryo survival of fertilized eggs (black bars) from adult wild-type and dn-raraa transgenic males. Mating was repeated every 7-14 days (data are mean±s.e.m.; n=4-6; **P<0.01, ***P<0.001), and fertilization and survival recorded 2 and 24 h post-fertilization (hpf), respectively. (F) qPCR quantification of RA-related gene and raraaDN391 transgene transcripts in 6- and 9-month-old wild-type and dn-raraa testicular samples. Data are mean fold-change±s.e.m. (n=3 or 4; *P<0.05, **P<0.01) and are expressed relative to the wild-type group, which is set at 1. (G) Transcript levels of steroidogenesis-related (star, hsd3b1, cyp17a1 and ar), Leydig cell (insl3) and myoid cell (tagln) genes in wild-type and dn-raraa transgenic adult testes. Data are shown as mean fold-change±s.e.m. (n=3 or 4; *P<0.05, **P<0.01) and are expressed relative to the wild-type group, which is set at 1 (dashed line). (H) 11-KT plasma levels from 6- and 9-month-old wild-type and dn-raraa males. Data are mean fold change±s.e.m. (n=3 or 4; *P<0.05).