
- Title
-
Migratory Neural Crest Cells Phagocytose Dead Cells in the Developing Nervous System
- Authors
- Zhu, Y., Crowley, S.C., Latimer, A.J., Lewis, G.M., Nash, R., Kucenas, S.
- Source
- Full text @ Cell
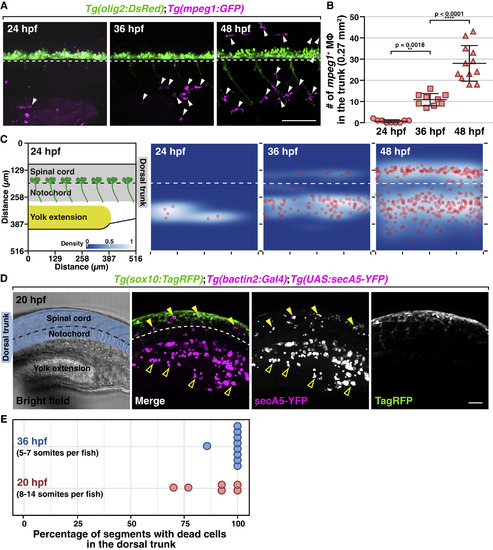
NCCs, but Not Macrophages, Colonize the Trunk Region during Early Development (A) Trunk lateral views of Tg(olig2:DsRed);Tg(mpeg1:GFP) embryos at 24, 36, and 48 hpf. Arrowheads denote mpeg1+ macrophages. (B) Macrophage quantification in a 0.27 mm2 region in the trunk of embryos at 24, 36, and 48 hpf (mean ± SD). (C) 2D distribution of macrophages in the trunk of embryos at 24, 36, and 48 hpf (n = 9 fish in each condition). Diagram on the left shows the region quantified. All images used for quantification are aligned based on the position of the ventral edge of the spinal cord (dashed line). (D) Lateral view of a Tg(sox10:TagRFP);Tg(bactin2:Gal4);Tg(UAS:secA5-YFP) embryo at 20 hpf. Blue shading denotes dorsal trunk. Filled arrowheads denote dead cells in the dorsal trunk. Open arrowheads denote debris in the ventral trunk/yolk extension. (E) Quantification of the percentage of somites with secA5+ cells in 20 and 36 hpf embryos (n = 65/56 somites in 6/9 fish for 20/36 hpf). Dashed lines mark the ventral edge of the spinal cord. Scale bars, 50 μm. |
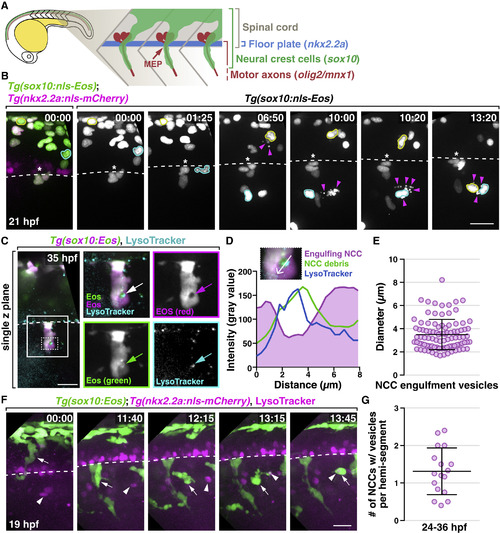
A Subset of NCCs Engulf Cellular Debris in the Developing PNS (A) Schematic diagram showing NCC migration in a 22 hpf embryo. (B) Images from a 21 h time-lapse movie of a Tg(sox10:nls-Eos);Tg(nkx2.2a:nls-mCherry) embryo starting at 19 hpf. Asterisks denote the location of MEP TZs. Arrowheads denote dead NCCs. NCCs that migrated toward debris are outlined in yellow and cyan. (C) Images from a 35 hpf Tg(sox10:Eos) embryo treated with LysoTracker Deep Red. Boxed region is magnified on the right. Arrows denote an engulfment vesicle. Region outlined with dashed box is magnified in (D). (D) Quantification of fluorescent intensity across the engulfment vesicle shown in (C). (E) Measurement of diameters of NCC engulfment vesicles (mean ± SD, n = 95 vesicles). (F) Images from a 21 h time-lapse movie starting at 19 hpf of a Tg(sox10:nls-Eos);Tg(nkx2.2a:nls-mCherry) embryo treated with LysoTracker Red DND-99. A NCC denoted (arrows) migrated toward and engulfs LysoTracker+ debris (arrowheads). Note that the white color of the engulfment vesicle indicates co-localization of that NCC and the corpse. Dashed line marks the ventral edge of the spinal cord. (G) Quantification of the number of engulfing NCCs per hemi-segment (mean ± SD, n = 17 fish, 3–6 somites per fish). Scale bars, 20 μm. |
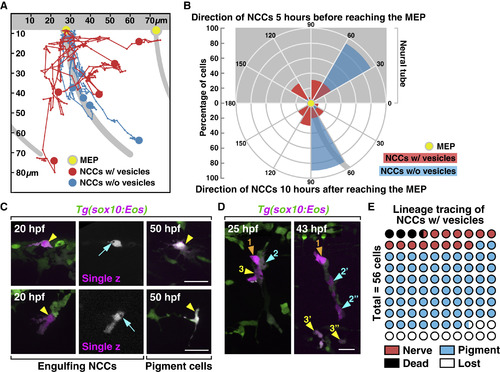
Migratory Patterns and Lineage Tracing of Engulfing NCCs (A) Trajectories of NCCs with (red, n = 5 cells) or without (blue, n = 5 cells) engulfment vesicles during a 10 h period after they reached MEP TZs (yellow dots). (B) Circular histogram showing directions of NCCs 5 h before (top, n = 13 cells for each group) or 10 h after (bottom, n = 10 cells for each group) they reached MEP TZs (yellow dot). (C and D) Lineage tracing of engulfing NCCs that were photoconverted at 20 hpf (arrowheads). Arrows in (C) denote engulfment vesicles. Color-coded arrowheads in (D) denote daughter cells derived from individual photoconverted NCCs. (E) Quantification of the lineage of engulfing NCCs photoconverted at 20 hpf (n = 56 cells). Grey background shows location of the neural tube and motor axons in (A) and (B). MEP, motor exit point. Scale bars, 20 μm. |
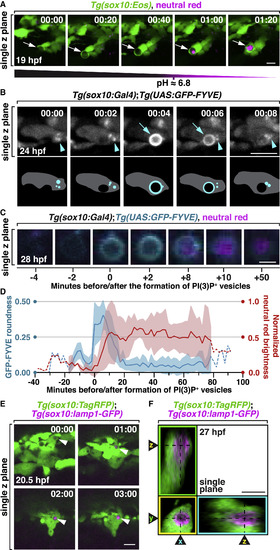
The Formation of PI(3)P+ and Lamp1+ Phagosomes after NCC Engulfment (A) Images from a time-lapse movie starting at 19 hpf in a Tg(sox10:nls-Eos) embryo treated with neutral red at 16 hpf. Arrows denote a NCC engulfment vesicle that was gradually stained by neutral red. (B) Images from a time-lapse movie of a 24 hpf Tg(sox10:Gal4);Tg(UAS:GFP-FYVE) embryo showing the fusion of scattered PI(3)P signals (arrowheads) with an engulfment vesicle (arrows). Schematic diagrams are shown below. (C) Images of an engulfment vesicle from a time-lapse movie of a 28 hpf Tg(sox10:Gal4);Tg(UAS:GFP-FYVE) embryo treated with neutral red. (D) Quantification of PI(3)P+ vesicle formation and normalized neutral red brightness over time (mean ± SD, n = 6 vesicles). Dashed line indicates time points with a small sample size. (E) Images from a time-lapse movie of a Tg(sox10:TagRFP);Tg(sox10:lamp1-GFP) embryo starting at 20 hpf. Arrowheads denote gradual enrichment of Lamp1-GFP in a NCC engulfment vesicle. (F) Orthogonal views of a Lamp1-GFP+ vesicle in a NCC. Scale bars, 10 μm in (A), (B), (E), and (F); 2 μm in (C). |
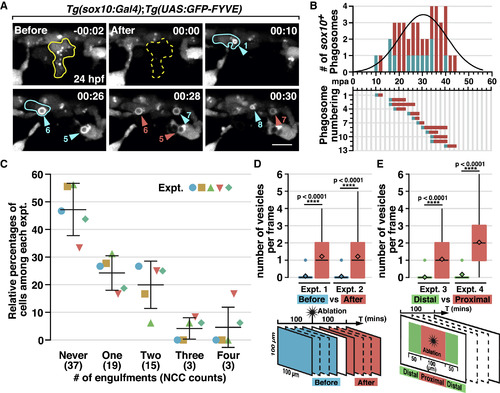
Laser Ablation-Induced NCC Phagocytosis (A) Images from a time-lapse movie of a Tg(sox10:Gal4);Tg(UAS:GFP-FYVE) embryo after ablation of a NCC (outlined in yellow) at 24 hpf. Arrowheads denote NCC engulfment vesicles. Cyan and red arrowheads denote newly formed and pre-existing vesicles, respectively, in each frame, correlating with the quantification in (B). A NCC that engulfed twice is outlined in cyan. (B) Quantification of phagosome formation in (A). Top panel shows phagosome count per frame fitted with a Gaussian curve (R square = 0.7075). Bottom panel shows the duration of each PI(3)P+ vesicle. (C) Quantification of the number of times NCCs phagocytose in a 100 μm2 region around the ablation site in 100 mpa (mean ± SD, n = 5 fish). (D and E) Quantification of the number of NCC phagosomes per frame before and after cell ablation (D), or distal and proximal to ablation sites (E) (n = 50 frames). mpa, minutes post ablation. Scale bar, 10 μm. |
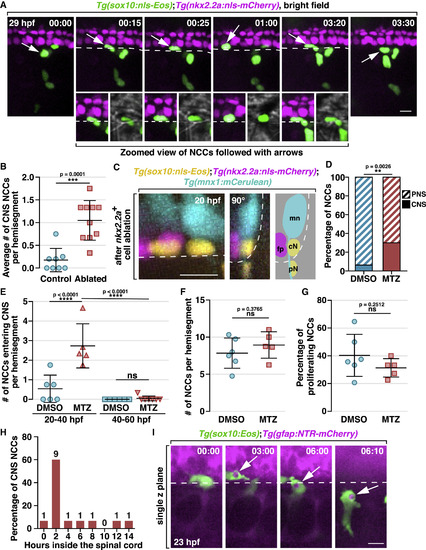
NCCs Migrate into the Spinal Cord and Phagocytose CNS Debris (A) Images from a time-lapse movie of a Tg(sox10:nls-Eos);Tg(nkx2.2a:nls-mCherry) embryo starting at 20 hpf. Arrows denote a NCC nuclei crossing into the CNS, which is magnified below. Dashed lines indicate the ventral edge of the spinal cord. (B) Quantification of the ratio of CNS-located NCCs per hemi-segment after ablation of 2 floorplate cells (mean ± SD, n = 8/10 fish for control/ablated). (C) Images of a Tg(sox10:nls-Eos);Tg(nkx2.2a:nls-mCherry);Tg(mnx1:mCerulean) embryo at 20 hpf after ablation of 2 nkx2.2a+ floorplate cells. Left: z projection; middle: 90° rotated image; right: schematic view of the rotated image, illustrating the locations of floorplate cells (fp), motor neurons (mn) and NCCs in the CNS (cN) and PNS (pN). (D) Quantification of the ratio of CNS-located NCCs in embryos with radial glial ablation (n = 5 fish) or DMSO-treated controls (n = 6 fish). The data includes NCCs in 3 hemi-segments per fish. (E) Quantification of the number of NCCs entering the CNS per hemi-segment in DMSO and MTZ-treated embryos within a 20-h time window (mean ± SD). (F and G) Quantification of the number of NCCs per hemi-segment (F) and the ratio of proliferating NCCs (G) in DMSO and MTZ-treated embryos between 20 to 40 hpf (mean ± SD). (H) Distribution of the length of time NCCs spent in the CNS (n = 15 cells). (I) Images from a time-lapse movie of a Tg(sox10:Eos);Tg(gfap:NTR-mCherry) embryo. Arrows denote a NCC engulfment vesicle filled with radial glia debris. Dashed lines mark the ventral edge of the spinal cord. Scale bars, 10 μm. |
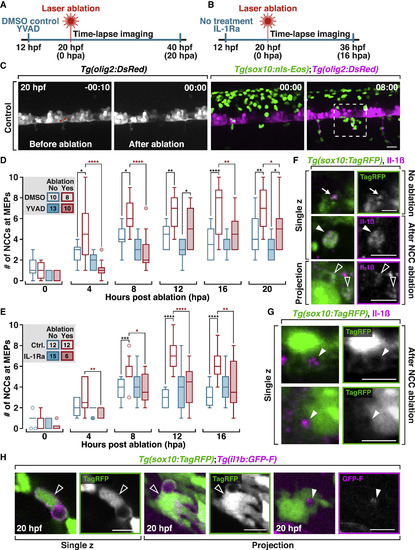
NCC Recruitment toward Damage Is Mediated by Il-1β Signaling (A) Schematic diagram of experimental design in (D), which is YVAD treatment versus control. (B) Schematic diagram of experimental design in (E), which is IL-1Ra treatment versus control. (C) Images from a time-lapse movie of a Tg(sox10:nls-Eos);Tg(olig2:DsRed) embryo before and after ablation of two motor neurons (asterisks). Dashed box indicates the region where the numbers of NCCs are counted in (D) and (E). (D) Quantification of the number of NCCs in DMSO or YVAD-treated embryos after ablation. Numbers in the legends denote the number of embryos quantified. ****p ≤ 0.0001; ***p ≤ 0.001; **p ≤ 0.01; *p ≤ 0.05. Same for (E). (E) Quantification of the number of NCCs in control embryos or embryos treated with IL-1Ra after motor neuron ablation. (F) Images from 20 hpf Tg(sox10:TagRFP) embryos labeled with an Il-1β antibody; NCC protrusions (arrows), NCC debris (filled arrowheads), and NCC engulfment vesicles (open arrowheads). (G) In 20 hpf Tg(sox10:TagRFP) embryos labeled with an Il-1β antibody, NCC vesicles are filled with Il-1β+ debris (arrowheads). (H) Images from Tg(sox10:TagRFP);il1b:GFP-F embryos at 20 hpf. Open arrowheads denote phagocytic NCCs that are il-1β+. Filled arrowheads denote il-1β+ debris inside a NCC vesicle. Scale bars, 20 μm in (C), 10 μm in (F)–(H). |
Reprinted from Cell, 179(1), Zhu, Y., Crowley, S.C., Latimer, A.J., Lewis, G.M., Nash, R., Kucenas, S., Migratory Neural Crest Cells Phagocytose Dead Cells in the Developing Nervous System, 74-89.e10, Copyright (2019) with permission from Elsevier. Full text @ Cell