
Fig. 5
- ID
- ZDB-FIG-200311-26
- Publication
- Zhu et al., 2019 - Migratory Neural Crest Cells Phagocytose Dead Cells in the Developing Nervous System
- Other Figures
- All Figure Page
- Back to All Figure Page
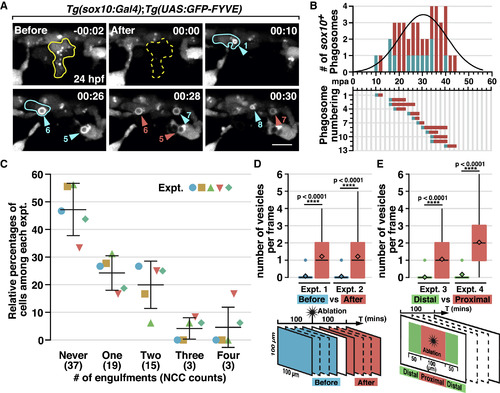
Laser Ablation-Induced NCC Phagocytosis (A) Images from a time-lapse movie of a Tg(sox10:Gal4);Tg(UAS:GFP-FYVE) embryo after ablation of a NCC (outlined in yellow) at 24 hpf. Arrowheads denote NCC engulfment vesicles. Cyan and red arrowheads denote newly formed and pre-existing vesicles, respectively, in each frame, correlating with the quantification in (B). A NCC that engulfed twice is outlined in cyan. (B) Quantification of phagosome formation in (A). Top panel shows phagosome count per frame fitted with a Gaussian curve (R square = 0.7075). Bottom panel shows the duration of each PI(3)P+ vesicle. (C) Quantification of the number of times NCCs phagocytose in a 100 μm2 region around the ablation site in 100 mpa (mean ± SD, n = 5 fish). (D and E) Quantification of the number of NCC phagosomes per frame before and after cell ablation (D), or distal and proximal to ablation sites (E) (n = 50 frames). mpa, minutes post ablation. Scale bar, 10 μm. |
Reprinted from Cell, 179(1), Zhu, Y., Crowley, S.C., Latimer, A.J., Lewis, G.M., Nash, R., Kucenas, S., Migratory Neural Crest Cells Phagocytose Dead Cells in the Developing Nervous System, 74-89.e10, Copyright (2019) with permission from Elsevier. Full text @ Cell