
|
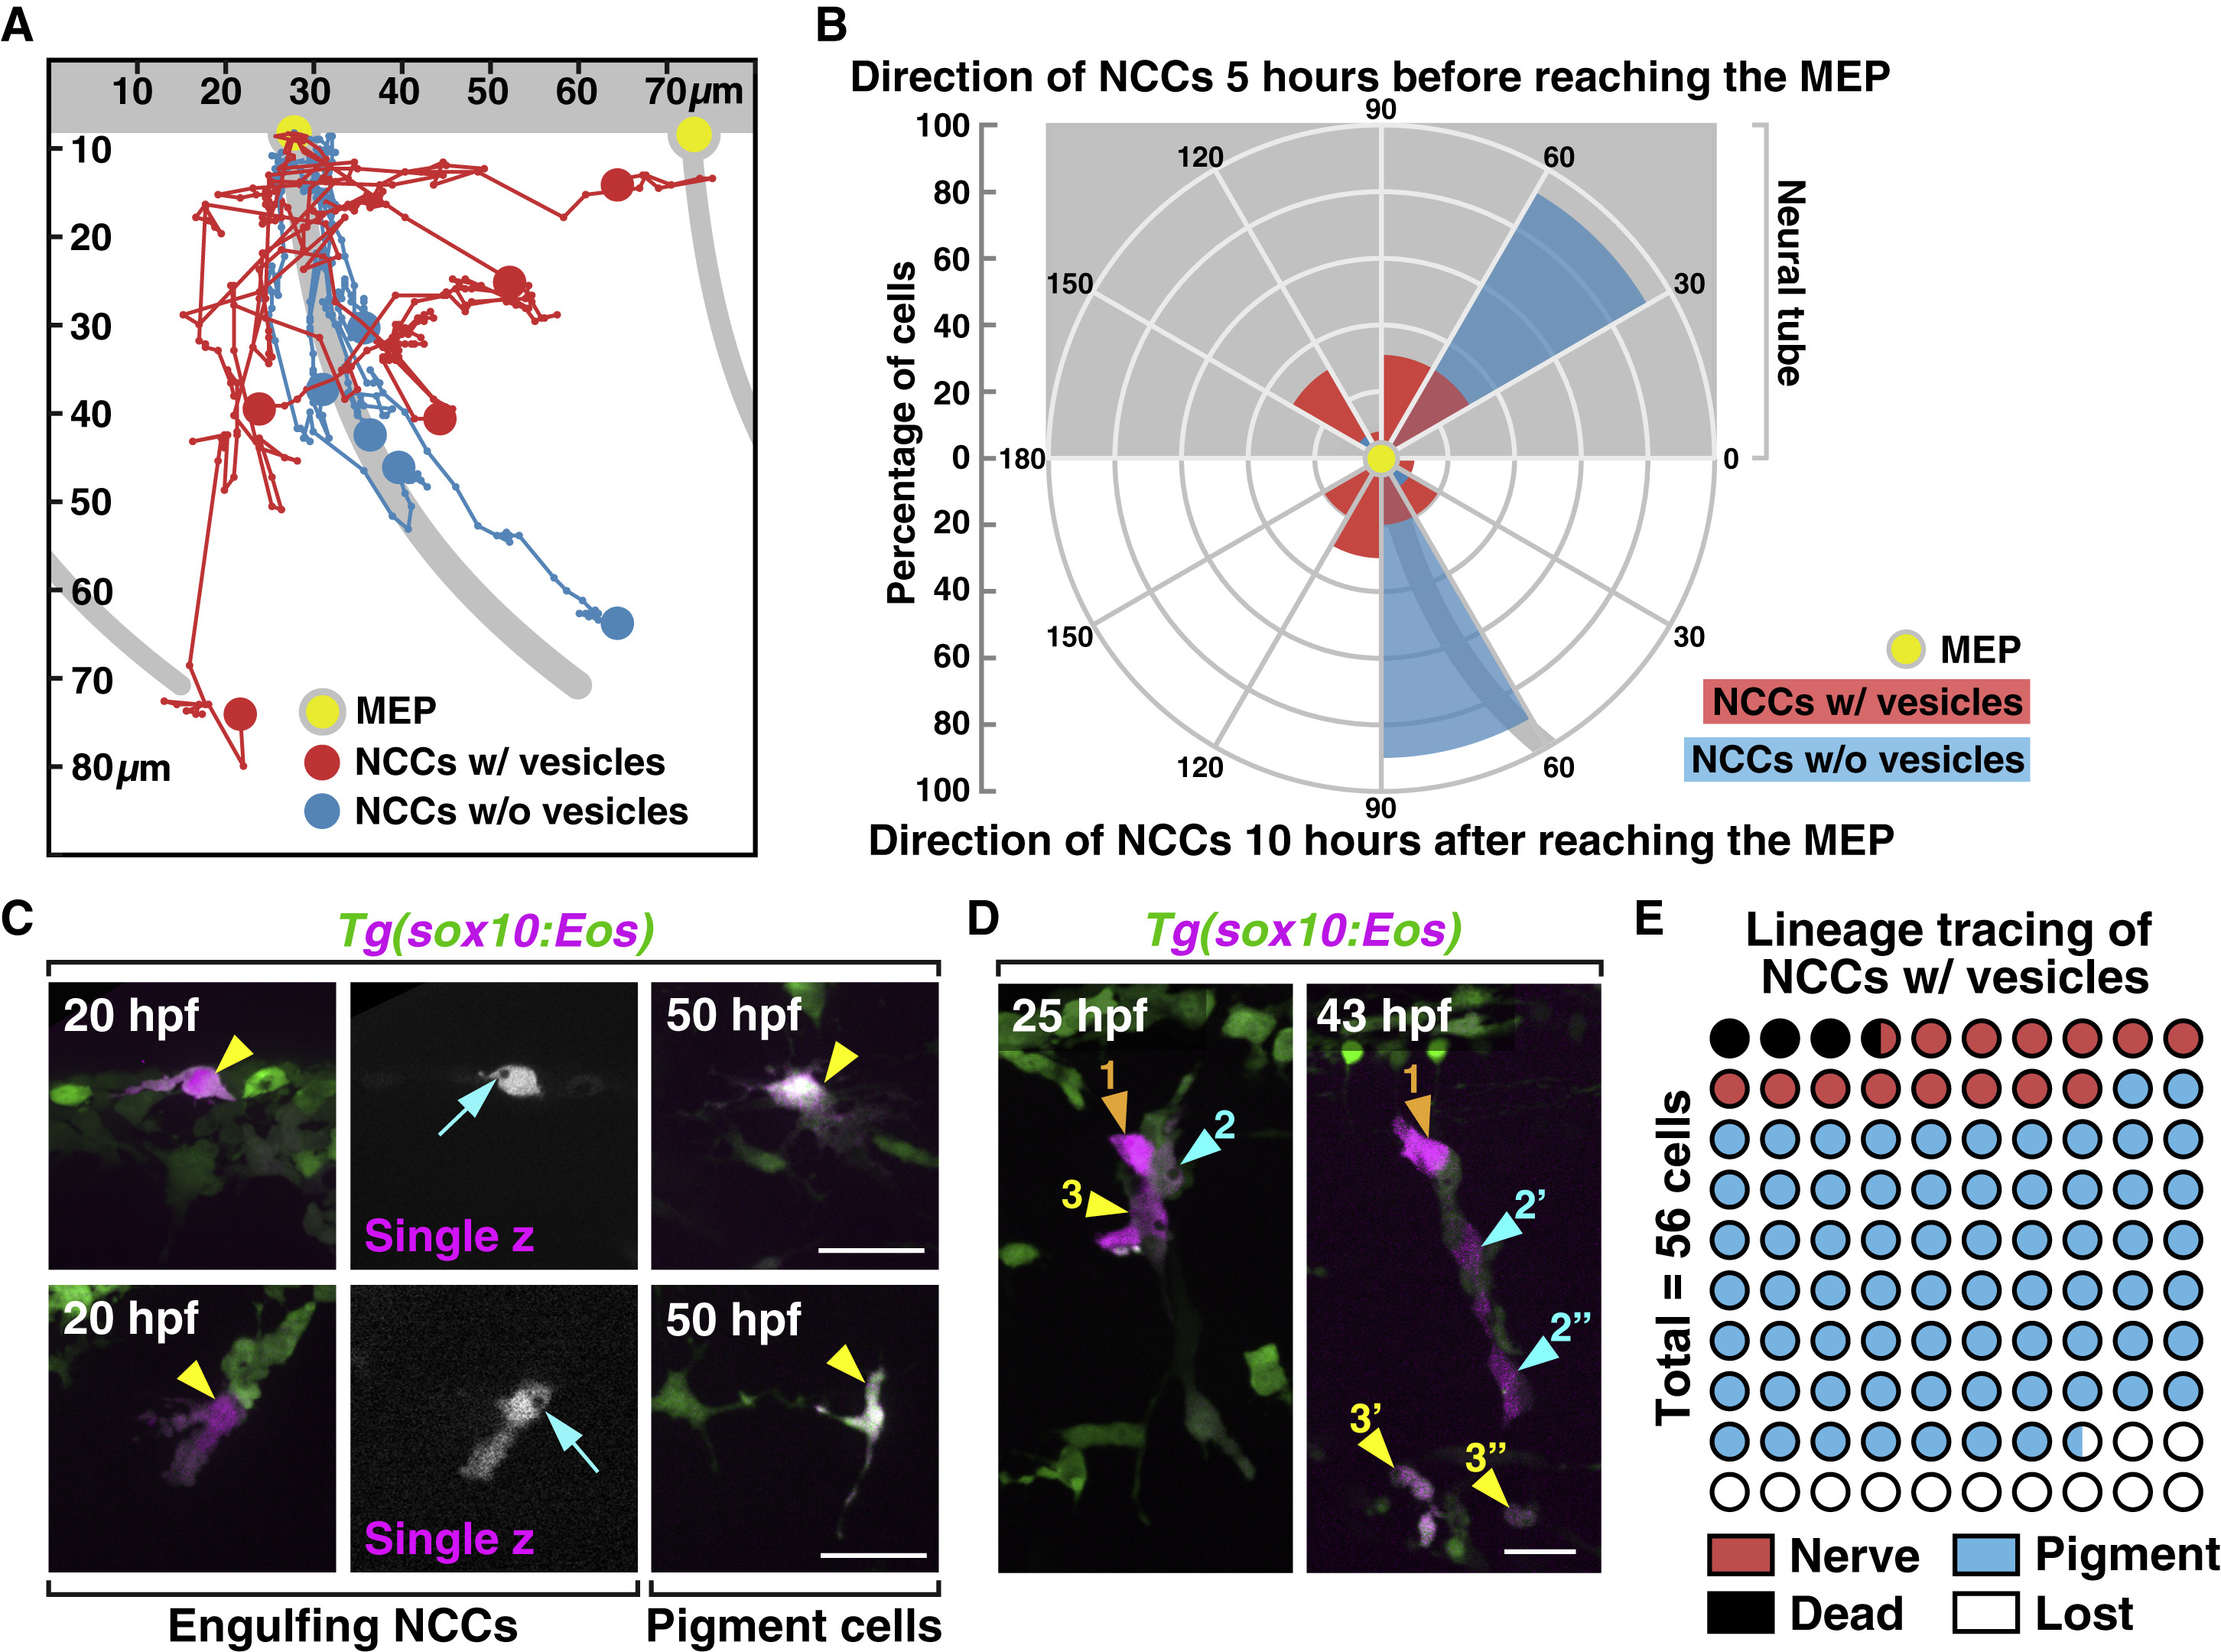
Fig. 3 Migratory Patterns and Lineage Tracing of Engulfing NCCs (A) Trajectories of NCCs with (red, n = 5 cells) or without (blue, n = 5 cells) engulfment vesicles during a 10 h period after they reached MEP TZs (yellow dots). (B) Circular histogram showing directions of NCCs 5 h before (top, n = 13 cells for each group) or 10 h after (bottom, n = 10 cells for each group) they reached MEP TZs (yellow dot). (C and D) Lineage tracing of engulfing NCCs that were photoconverted at 20 hpf (arrowheads). Arrows in (C) denote engulfment vesicles. Color-coded arrowheads in (D) denote daughter cells derived from individual photoconverted NCCs. (E) Quantification of the lineage of engulfing NCCs photoconverted at 20 hpf (n = 56 cells). Grey background shows location of the neural tube and motor axons in (A) and (B). MEP, motor exit point. Scale bars, 20 μm.
Reprinted from Cell, 179(1), Zhu, Y., Crowley, S.C., Latimer, A.J., Lewis, G.M., Nash, R., Kucenas, S., Migratory Neural Crest Cells Phagocytose Dead Cells in the Developing Nervous System, 74-89.e10, Copyright (2019) with permission from Elsevier. Full text @ Cell