
|
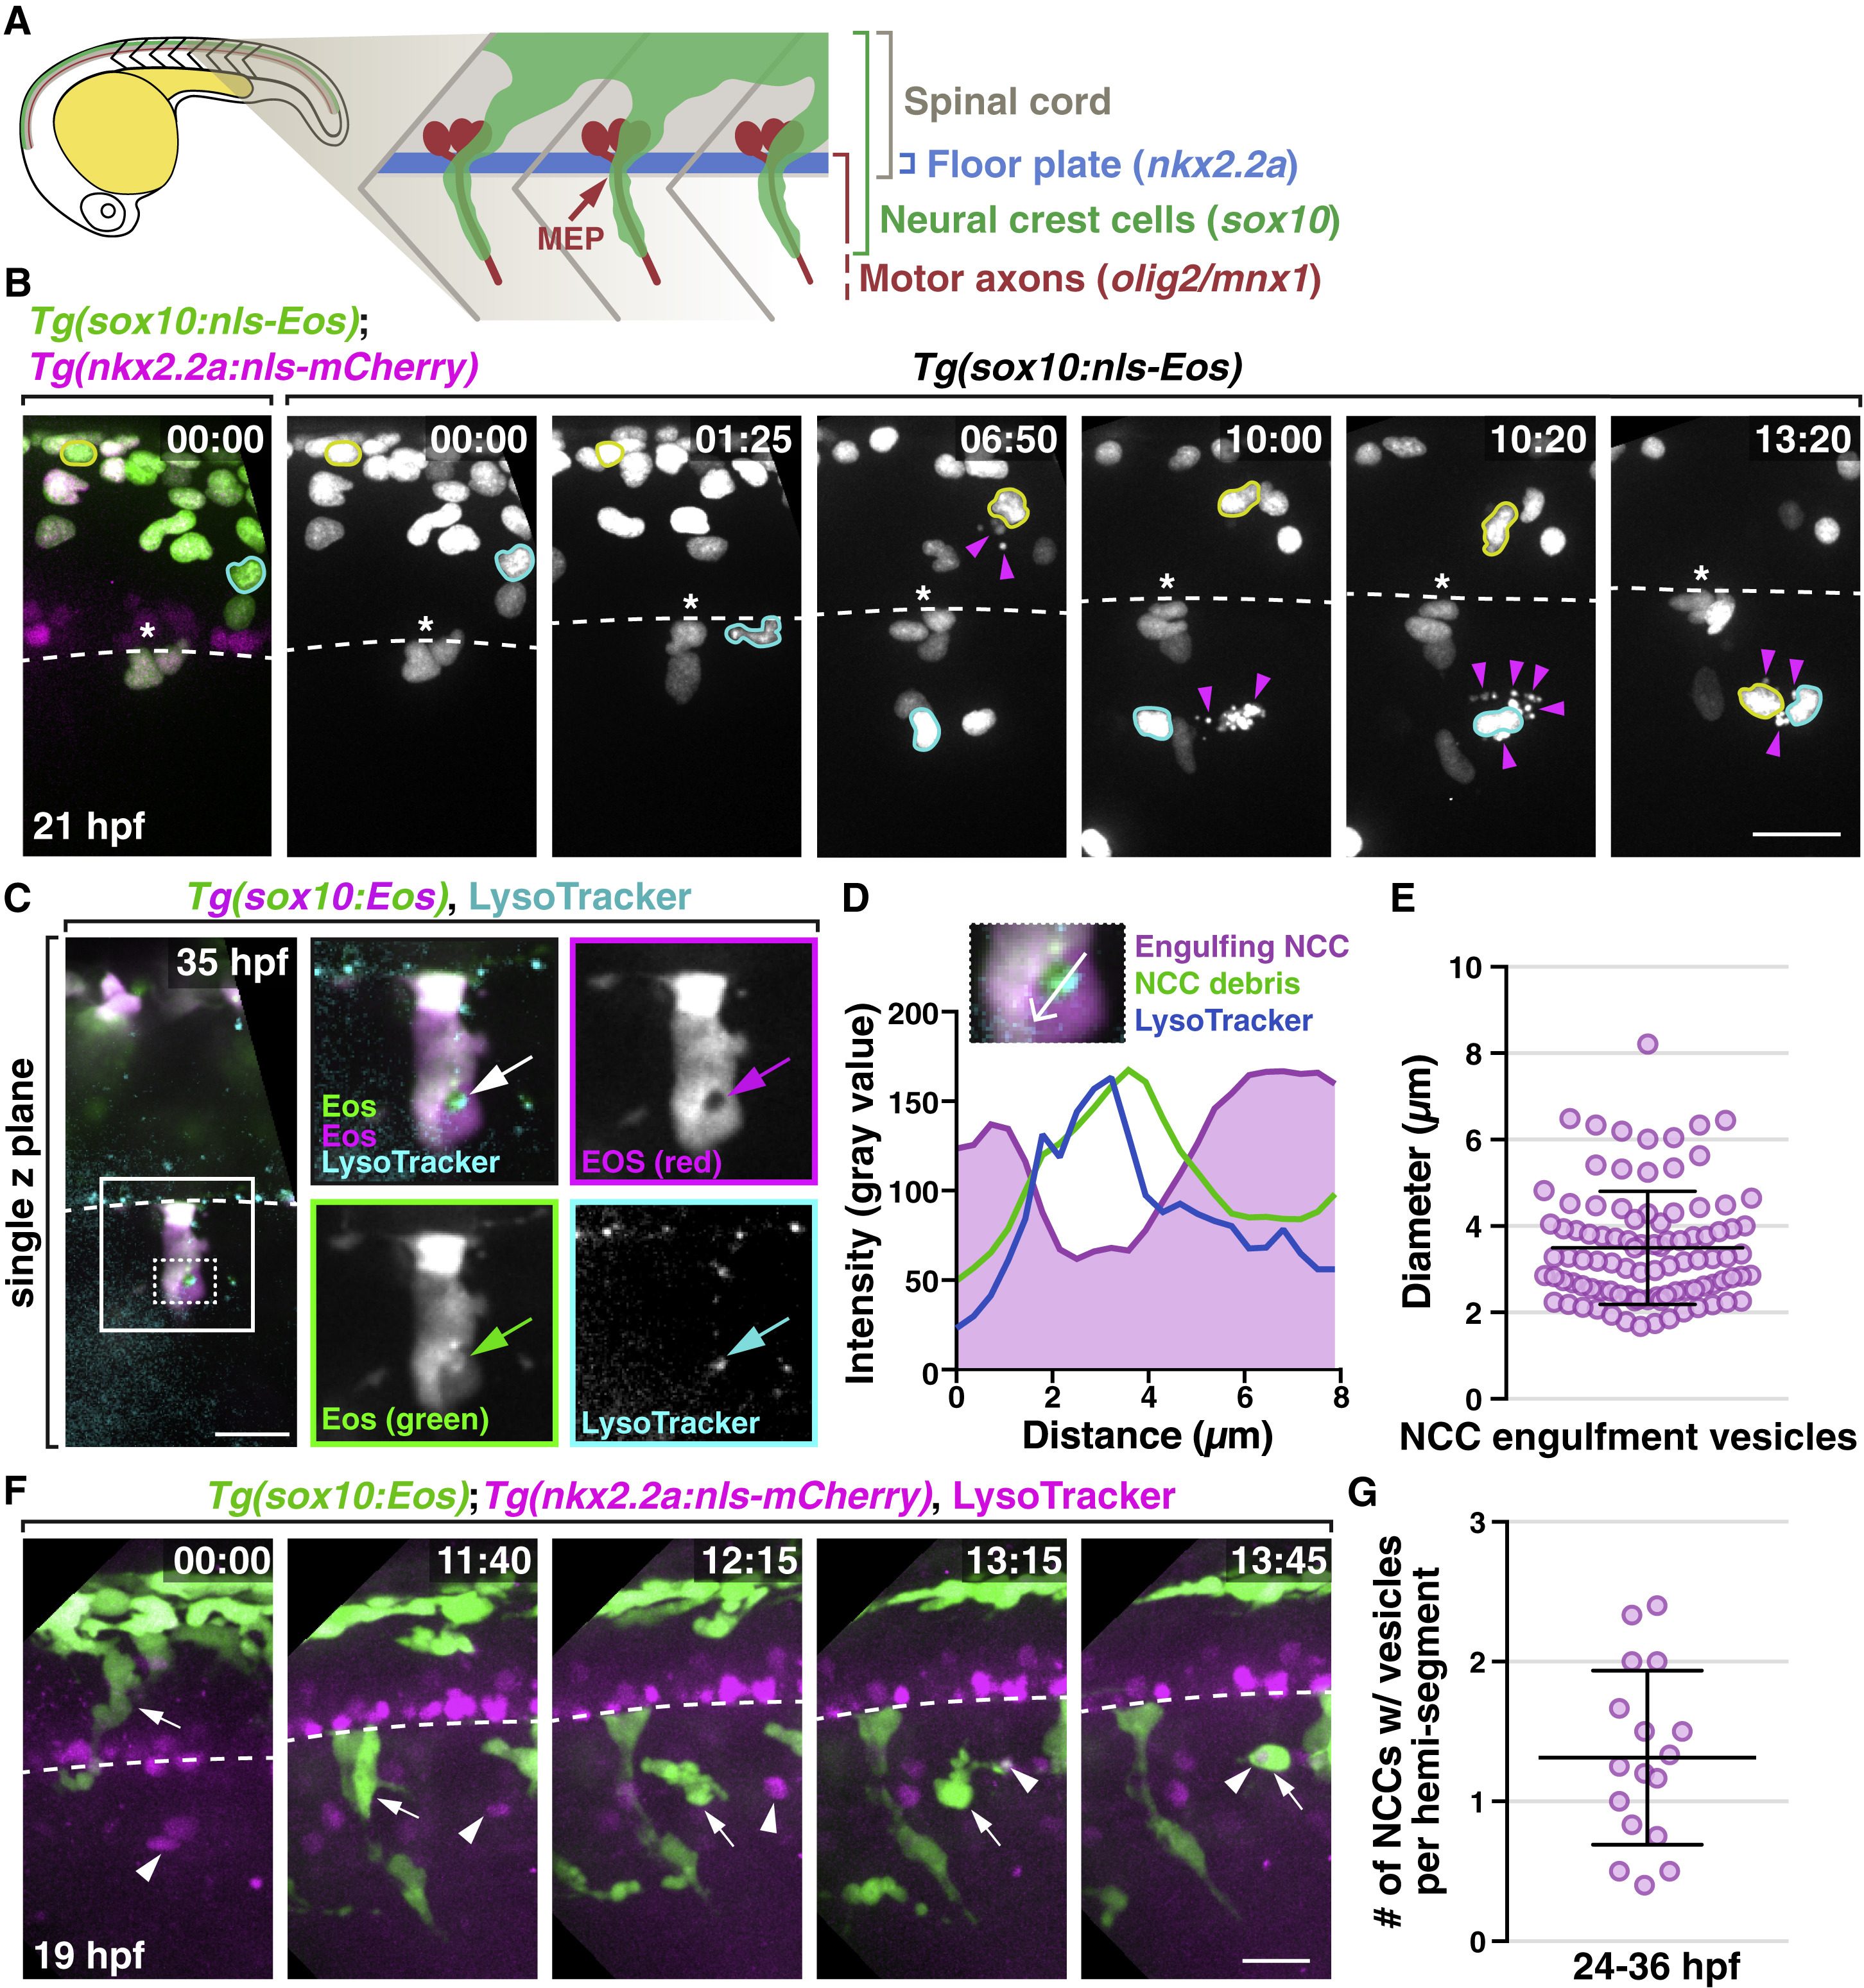
Fig. 2 A Subset of NCCs Engulf Cellular Debris in the Developing PNS (A) Schematic diagram showing NCC migration in a 22 hpf embryo. (B) Images from a 21 h time-lapse movie of a Tg(sox10:nls-Eos);Tg(nkx2.2a:nls-mCherry) embryo starting at 19 hpf. Asterisks denote the location of MEP TZs. Arrowheads denote dead NCCs. NCCs that migrated toward debris are outlined in yellow and cyan. (C) Images from a 35 hpf Tg(sox10:Eos) embryo treated with LysoTracker Deep Red. Boxed region is magnified on the right. Arrows denote an engulfment vesicle. Region outlined with dashed box is magnified in (D). (D) Quantification of fluorescent intensity across the engulfment vesicle shown in (C). (E) Measurement of diameters of NCC engulfment vesicles (mean ± SD, n = 95 vesicles). (F) Images from a 21 h time-lapse movie starting at 19 hpf of a Tg(sox10:nls-Eos);Tg(nkx2.2a:nls-mCherry) embryo treated with LysoTracker Red DND-99. A NCC denoted (arrows) migrated toward and engulfs LysoTracker+ debris (arrowheads). Note that the white color of the engulfment vesicle indicates co-localization of that NCC and the corpse. Dashed line marks the ventral edge of the spinal cord. (G) Quantification of the number of engulfing NCCs per hemi-segment (mean ± SD, n = 17 fish, 3–6 somites per fish). Scale bars, 20 μm.
Reprinted from Cell, 179(1), Zhu, Y., Crowley, S.C., Latimer, A.J., Lewis, G.M., Nash, R., Kucenas, S., Migratory Neural Crest Cells Phagocytose Dead Cells in the Developing Nervous System, 74-89.e10, Copyright (2019) with permission from Elsevier. Full text @ Cell