
|
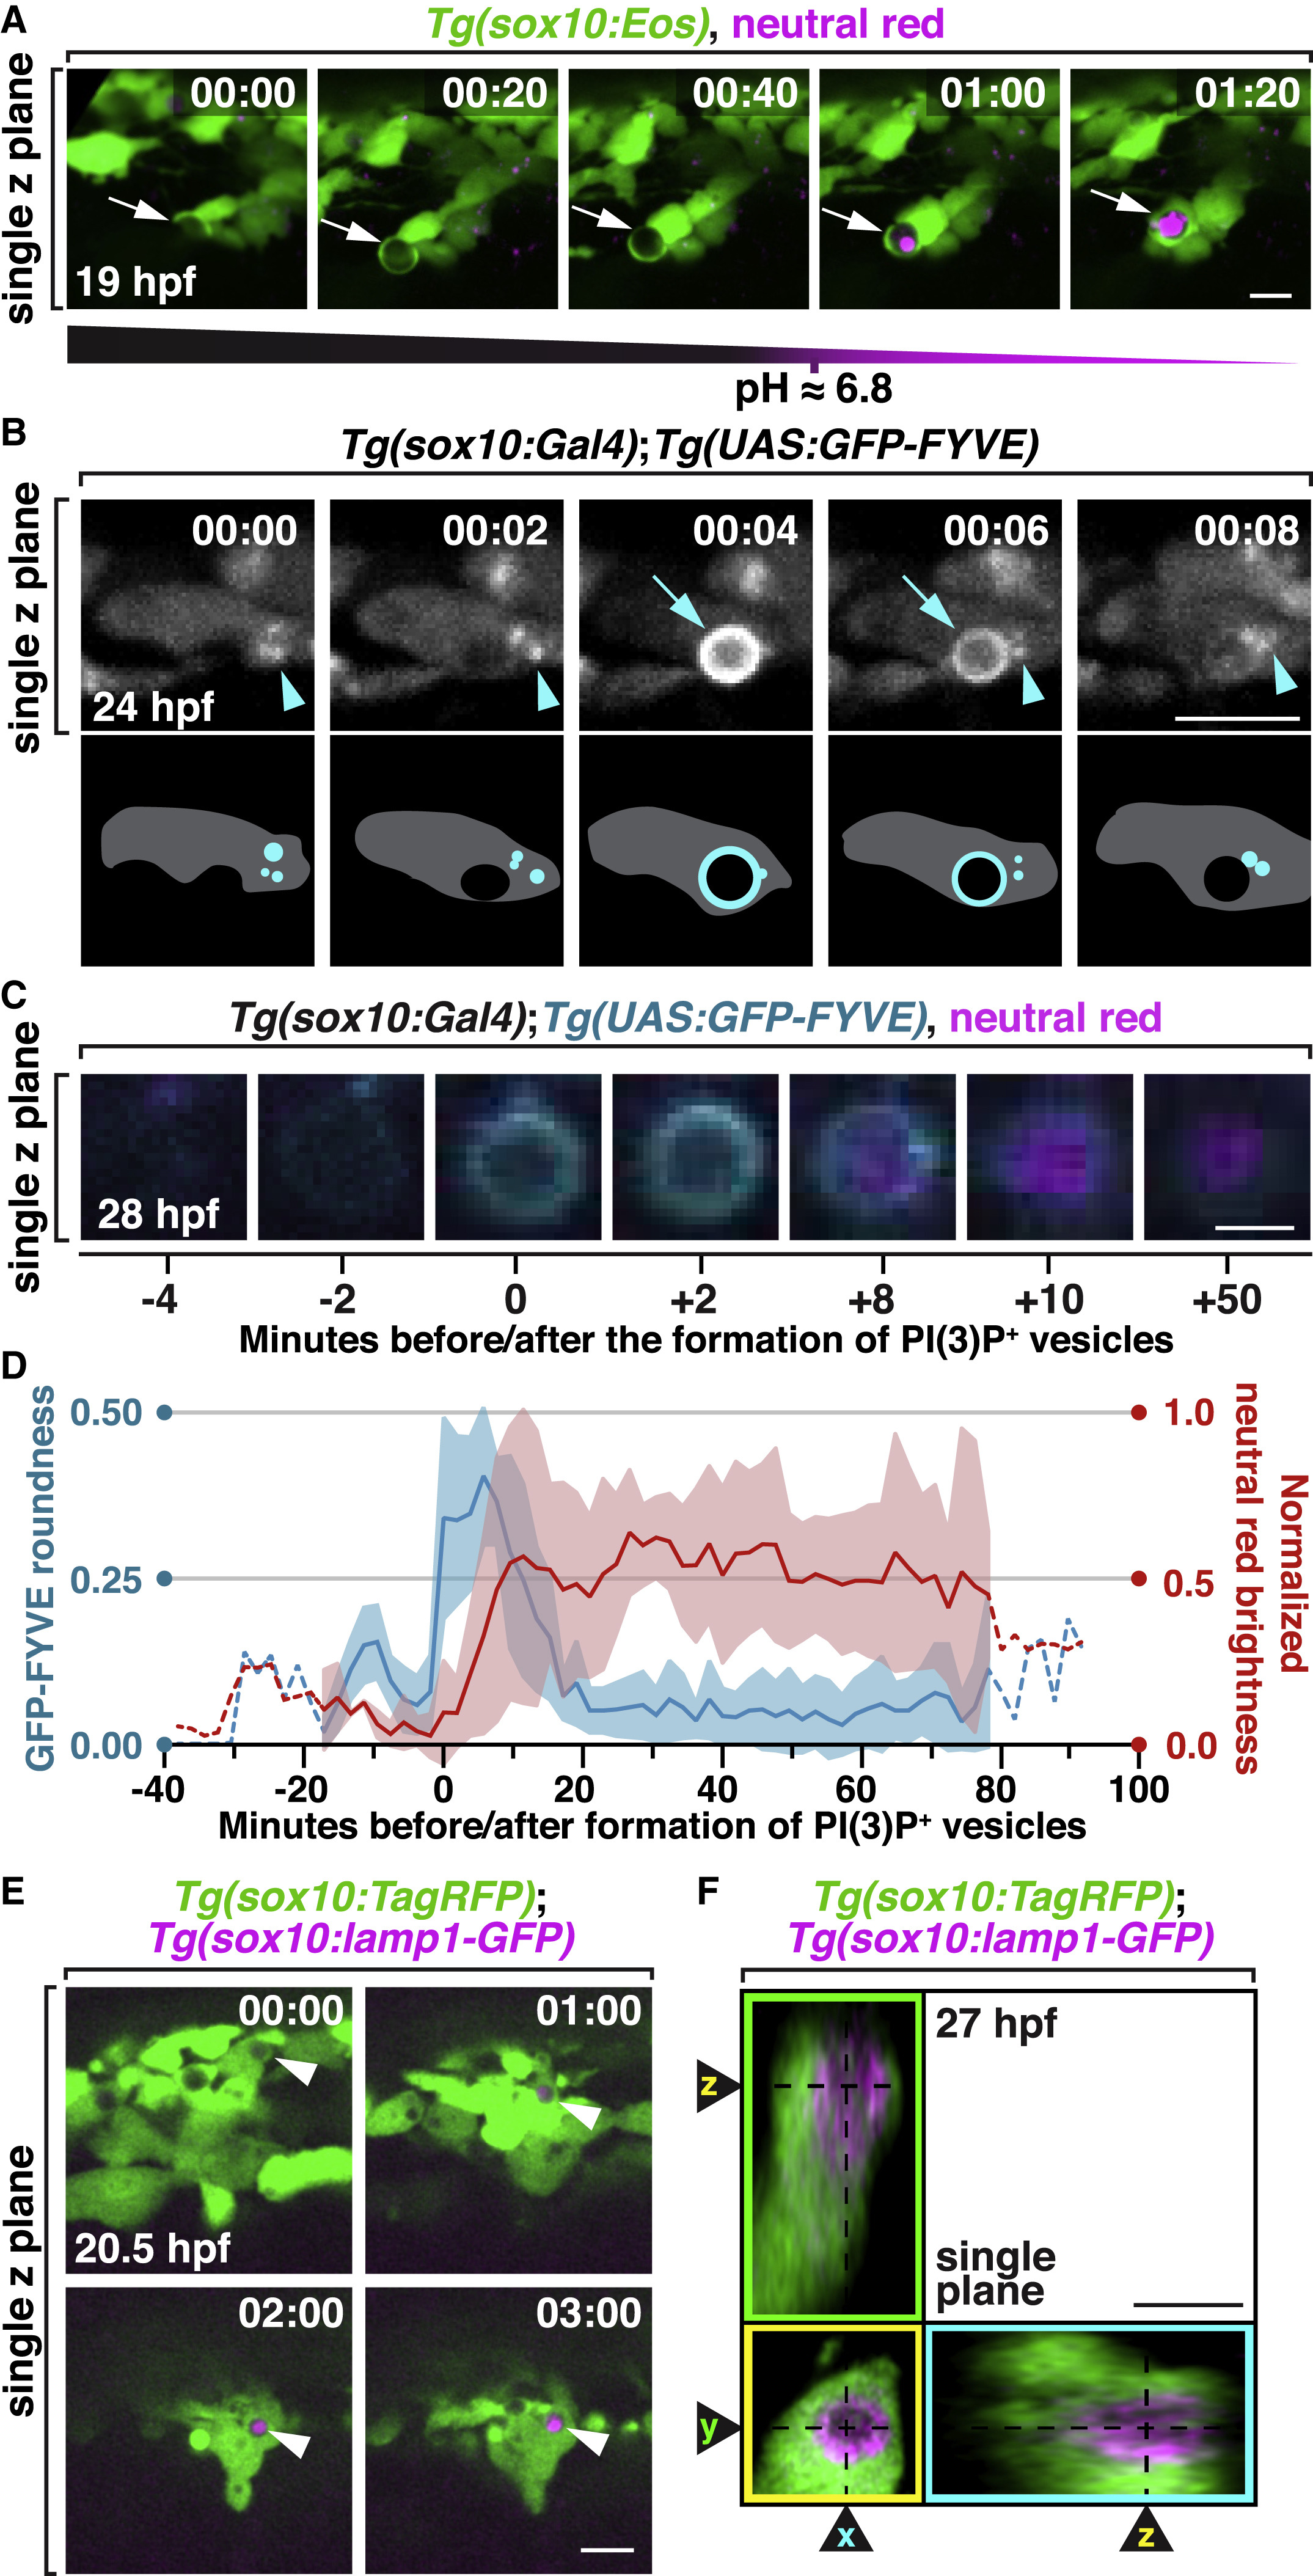
Fig. 4 The Formation of PI(3)P+ and Lamp1+ Phagosomes after NCC Engulfment (A) Images from a time-lapse movie starting at 19 hpf in a Tg(sox10:nls-Eos) embryo treated with neutral red at 16 hpf. Arrows denote a NCC engulfment vesicle that was gradually stained by neutral red. (B) Images from a time-lapse movie of a 24 hpf Tg(sox10:Gal4);Tg(UAS:GFP-FYVE) embryo showing the fusion of scattered PI(3)P signals (arrowheads) with an engulfment vesicle (arrows). Schematic diagrams are shown below. (C) Images of an engulfment vesicle from a time-lapse movie of a 28 hpf Tg(sox10:Gal4);Tg(UAS:GFP-FYVE) embryo treated with neutral red. (D) Quantification of PI(3)P+ vesicle formation and normalized neutral red brightness over time (mean ± SD, n = 6 vesicles). Dashed line indicates time points with a small sample size. (E) Images from a time-lapse movie of a Tg(sox10:TagRFP);Tg(sox10:lamp1-GFP) embryo starting at 20 hpf. Arrowheads denote gradual enrichment of Lamp1-GFP in a NCC engulfment vesicle. (F) Orthogonal views of a Lamp1-GFP+ vesicle in a NCC. Scale bars, 10 μm in (A), (B), (E), and (F); 2 μm in (C).
Reprinted from Cell, 179(1), Zhu, Y., Crowley, S.C., Latimer, A.J., Lewis, G.M., Nash, R., Kucenas, S., Migratory Neural Crest Cells Phagocytose Dead Cells in the Developing Nervous System, 74-89.e10, Copyright (2019) with permission from Elsevier. Full text @ Cell