
- Title
-
Nucleus Isthmi Is Required to Sustain Target Pursuit during Visually Guided Prey-Catching
- Authors
- Henriques, P.M., Rahman, N., Jackson, S.E., Bianco, I.H.
- Source
- Full text @ Curr. Biol.
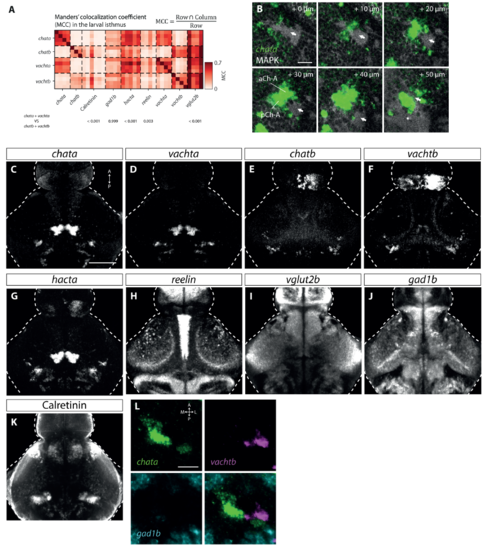
Isthmic gene expression, related to Figure 1. (A) Manders’ colocalization coefficient (MCC) quantifying overlap of markers in the larval isthmus. This data shows all pairwise comparisons between single brains with mean values shown in Figure 1H. p-values correspond to comparisons of MCC for chata+vachta versus chatb+vachtb and the corresponding upper labels (Tukey’s HSD correction for multiple comparisons following 2-way ANOVA). (B) MAPK expression in the isthmus showing the large cerebellar fascicle (white arrows) adjacent to and crossing chata expression. Scale bar, 25 mm. (C-K) Registered expression of markers used to characterize the larval isthmus. (C-H) show maximum-intensity projections across the entire dorso-ventral extent of the brain (325 mm), while (I-K) show projections across a smaller dorso-ventral region at the level of the isthmus (90 mm). All images show median intensity across registered datasets. Scale bar 100 mm. (L) Single focal plane from a triple fluorescent in situ of a 6 dpf larval brain detecting chata, vachtb and gad1b mRNA in the right isthmus. Almost no overlap is observed between these markers. Scale bar, 20 mm. |
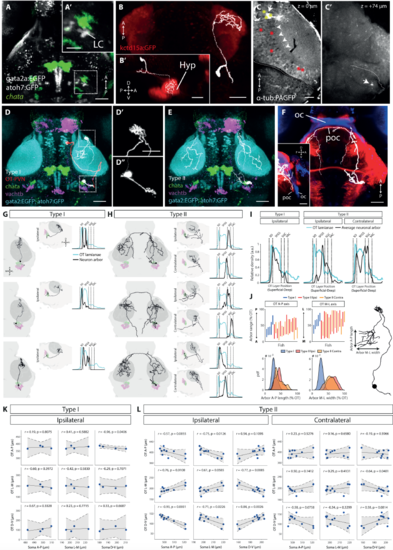
NI Type I and Type II neurons, related to Figure 2. (A) Et(gata2a:EGFP);Tg(atoh7:GFP) double transgenic used for electroporation of cells in the larval isthmus. Maximum intensity projection overlaid with registered chata expression. Scale bar, 50 mm. (A’) Isthmic region showing cells of the locus coeruleus (LC) in close proximity to chata expression. Scale bar, 25 mm. (B,B’) Electroporated neuron in the isthmic region projecting to the hypothalamus, labelled by kctd15a:GFP [S1]. (B’) shows lateral view. Scale bars, 50 mm. (C) Photo-activated PVNs in the rostral OT of a Tg(alpha tubulin:C3PA-GFP) larva. White arrow indicates location of photo-activation that resulted in labelling of several PVN somata. White arrowheads mark a single axon projecting from a photo-activated PVN. Yellow asterisks mark photo-activated regions in additional specimens that resulted in labelling of tectofugal projections to the ventrolateral anterior hindbrain, whereas red asterisks mark regions which did not. White dotted line indicates midbrain-hindbrain boundary. Scale bar, 25 mm. (C’) Terminal arbor (white arrow) of the axon in (C), located in the ventrolateral anterior hindbrain. Complete traced projection is shown in panel (D), Figure 2A and Video S1. (D) Registered tracing of Type I neuron (white) and photo-activated OT PVN (red), overlaid with relevant markers. Same example cells as Figure 2A. Scale bar, 50 mm. (D’,D”) Magnified views of AF7 arborization and presumptive dendrite in hindbrain. (E) Registered tracing of Type II neuron (white), shown also in Figure 2B. (F) Type II axon decussating through the post-optic commissure (poc), marked by expression of dbx1a:Gal4 (red). The optic chiasm (oc), is located more rostrally and marked by atoh7:GFP (blue). Scale bar, 50 mm. Inset: Lateral view. (G-H) Registered tracings of Type I and Type II neurons, along with density profiles showing axon terminal distributions across tectal laminae. (I) Mean tectal lamination density profiles for all traced Type I (n = 5) and Type II (n = 10) cells. (J) Size and locations of Type I and Type II terminal arbors in OT. Bottom panel shows the distribution of arbor length and width as a fraction of tectal length/width. (K-L) Analysis of topographic innervation of OT. Locations of electroporated Type I (n = 4) and Type II (n = 10) cell bodies are plotted against centroid locations of terminal arbors in OT. We only considered datasets where there was no sign of registration error in any region of the brain and therefore one traced Type I cell was excluded due to registration uncertainty in the isthmic hindbrain. Linear fits to the data are shown with 95% confidence bounds. r, Pearson’s correlation coefficient. Student’s t-test. |
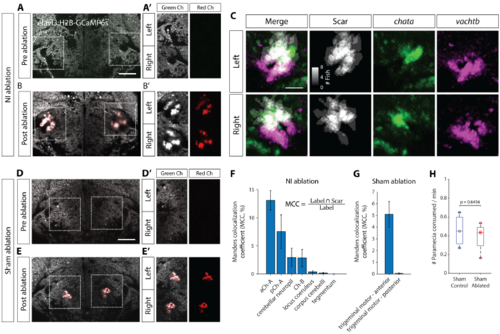
Laser ablations in isthmus, related to Figure 4. (A) 2-photon image of a 6 dpf Tg(elavl3:H2B-GCaMP6s) brain at the level of NI before ablation. Scale bar, 50 mm. (A’) Isthmic region marked with dotted boxes in (A), showing green and red fluorescence channels. Before ablation there is no signal in the red channel. White arrow marks location of the cerebellar fascicle that can be used to locate NI. (B) Post-ablation image of the same brain. (B’) The auto-fluorescent ablation scar can be seen in both green and red channels. (C) Sum of registered binary masks of ablation scars from 8 fish, overlaid with chata and vachtb expression. Scale bar, 25 mm. (D-E’) Sham ablation of a region medially adjacent to NI. (F) Manders’ colocalization coefficients (MCC) quantifying the percentage of voxels in ZBB brain regions that co-localize with the ablation scar for NI-ablations. Mean sem, N = 8 fish. (G) MCC quantification for sham ablation. (H) Prey consumption rates for sham-ablated larvae and their agarose-mounted sibling controls. Two sample t-test. |
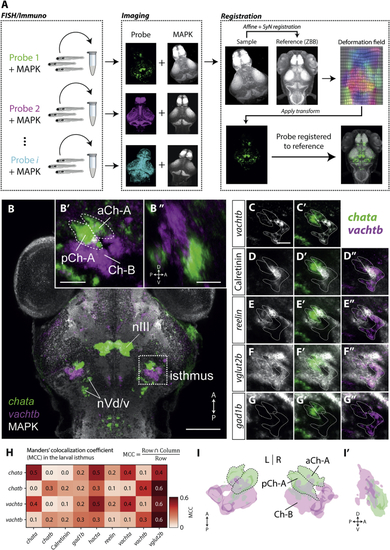
The Larval Zebrafish Isthmus Contains Two Cholinergic Gene Expression Domains (A) Whole-brain registration pipeline. Fluorescent (B) Dorsal view showing expression of the cholinergic genes (C–G”) (H) Mander’s colocalization coefficient (MCC) quantifying overlap of markers in the larval isthmus. For each row marker, MCC represents the fraction of labeled voxels that coexpress the column marker. Values are means of pairwise comparisons across all specimens ( (I) 3D rendering of cholinergic expression domains in the isthmus. (I’) Sagittal view of 3D rendering shows right isthmic region. nIII, oculomotor nucleus; nVd/v, dorsal and ventral trigeminal nuclei. See also |
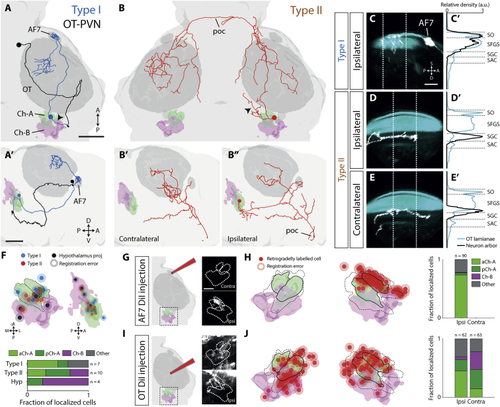
Two Types of NI Projection Neuron with Distinct Tectal and Pretectal Connectivity (A and B) Examples of a type I (A and A’) and a type II (B–B”) projection neuron that were labeled by electroporation. (A) also shows a photo-activated OT PVN neuron, projecting to isthmus (black). Neuronal tracings have been registered to the atlas and are overlaid with 3D-rendered masks displaying relevant brain areas. Top panels are dorsal views, and lower panels show lateral views. Black arrowheads indicate the putative dendrites of isthmic neurons. Scale bars, 50 μm. (C–E’) Type I (C and C’) and type II (D–E’) axonal arborizations (white) in OT neuropil laminae (cyan). The imaging volume was rotated clockwise about the A-P axis ∼30° and then clockwise about the left-right (L-R) axis ∼40° to enable clearer visualization of the laminae. A density projection (C’, D’, and E’) along the superficial-deep tectal axis was taken over a volume that encompasses most of the axon arbors (60 μm). Dotted white lines delineate the area used to compute density profiles shown on the right (normalized to maximum). Scale bar, 25 μm. (F) Localization of electroporated cells within isthmic domains. Top shows dorsal and lateral renderings of the Ch-A and Ch-B domains with registered locations of electroporated somata. Shading around each point represents mean registration uncertainty. Bottom quantifies localization of cell types across domains. (G) Iontophoretic labeling of AF7. Schematic of DiI application is shown with insets showing the isthmus of a single registered brain with retrograde labeling in the ipsilateral aCh-A domain. (H) Locations of retrogradely labeled somata following iontophoretic labeling of the right AF7 (n = 6 fish). Black lines show mean boundaries of aCh-A and pCh-A, and dotted lines show Ch-A maximum boundaries. (I) Iontophoretic labeling of OT neuropil. Insets show retrograde labeling in both the ipsilateral and contralateral isthmus. (J) Locations of labeled somata following iontophoretic labeling of the right OT neuropil (n = 10 fish). A, anterior; AF7, arborization field 7; D, deep; OT, optic tectum; P, posterior; poc, post-optic commissure; S, superficial. See also |
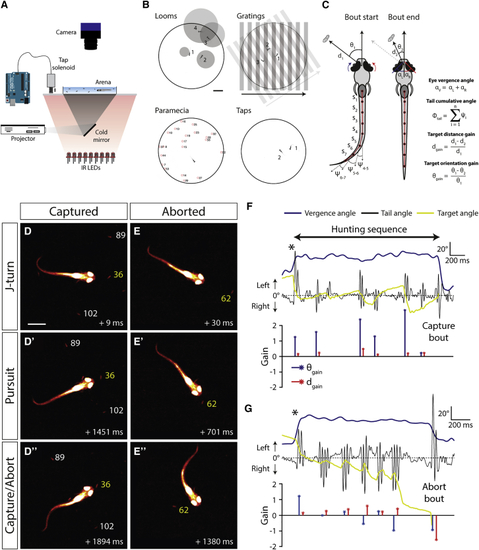
High-Speed Behavioral Tracking of Hunting Routines (A) Experimental setup used for testing free-swimming behavior. (B) Illustrations of stimuli presented to the larvae overlaid with video frames of resultant behavioral responses. For looming stimuli, video frames from stimulus onset: 1, +1 s; 2, +1.8 s; 3, +2.4 s; and 4, +2.7 s. For directional drifting gratings: 1, +1.3 s; 2, +2.7 s; and 3, +4 s. For solenoid-induced mechano-acoustic tap stimuli: 1, +0.1 s and 2, +0.17 s. For (C) Schematic illustrating extraction of kinematic variables and hunting performance metrics. Distance and orientation gains are computed from changes between start and end of each swim bout in a hunting routine. For details, see (D–D”) Video frames from a hunting routine that ended with a successful capture. The target (E–E”) A hunting routine that was aborted. Frame timestamps are relative to time of hunting onset (convergent saccade). (F) Behavioral kinematics for routine in (D). Black asterisk marks the convergent saccade at the beginning of the hunting routine. Lower plot shows gain values for each swim bout. In this case, distance and orientation gains are positive for all bouts. (G) Data for the aborted hunting routine in (E). The final bout has negative distance and orientation gain, and vergence concurrently returns to baseline levels. |
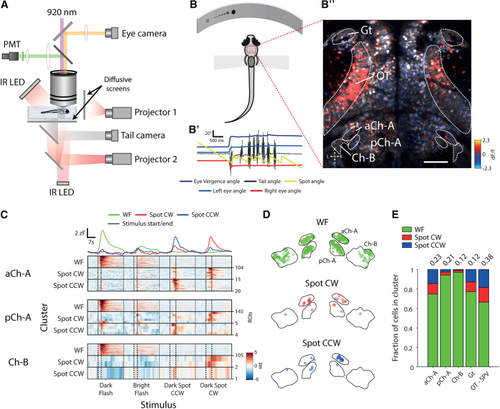
NI Neurons Respond to Looming and Prey-like Visual Stimuli (A) Schematic of the 2-photon setup to record neuronal activity and visually evoked behavior in tethered larval zebrafish. (B) Schematic of the virtual hunting assay. (B’) Tail, eye, and stimulus dynamics during a tethered hunting routine are shown. The prey-like spot is moved to the midline when the fish converges its eyes and after subsequent swim bouts. (B”) Map of neuronal activity (ΔF/F) in response to a leftward moving prey-like spot is shown. Scale bar, 50 μm. (C) Visual responses of isthmic neurons. Rasters show VRVs of cells assigned to visual clusters in the virtual hunting experiment. Top traces represent the mean VRV for all clustered isthmic neurons. (D) Anatomical distribution of visually responsive cells in the isthmus, colored by cluster type. For illustration purposes, the distances between regions have been offset, but distances within each region are correct. Boundaries are drawn at a single dorsoventral level. (E) Visual response types by brain region. Numbers on top show the fraction of cells in the brain region that were assigned cluster identities (aCh-A, n = 139; pCh-A, n = 154; Ch-B, n = 108; Gt, n = 194; OT-SPV, n = 3,703). See also |