
|
Fig. S3
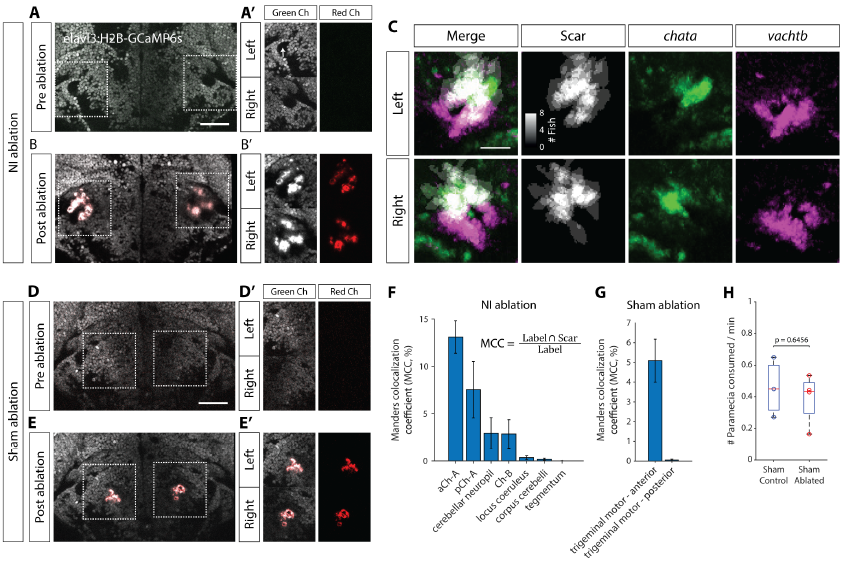
Laser ablations in isthmus, related to Figure 4. (A) 2-photon image of a 6 dpf Tg(elavl3:H2B-GCaMP6s) brain at the level of NI before ablation. Scale bar, 50 mm. (A’) Isthmic region marked with dotted boxes in (A), showing green and red fluorescence channels. Before ablation there is no signal in the red channel. White arrow marks location of the cerebellar fascicle that can be used to locate NI. (B) Post-ablation image of the same brain. (B’) The auto-fluorescent ablation scar can be seen in both green and red channels. (C) Sum of registered binary masks of ablation scars from 8 fish, overlaid with chata and vachtb expression. Scale bar, 25 mm. (D-E’) Sham ablation of a region medially adjacent to NI. (F) Manders’ colocalization coefficients (MCC) quantifying the percentage of voxels in ZBB brain regions that co-localize with the ablation scar for NI-ablations. Mean sem, N = 8 fish. (G) MCC quantification for sham ablation. (H) Prey consumption rates for sham-ablated larvae and their agarose-mounted sibling controls. Two sample t-test.