
|
Figure 2
Two Types of NI Projection Neuron with Distinct Tectal and Pretectal Connectivity
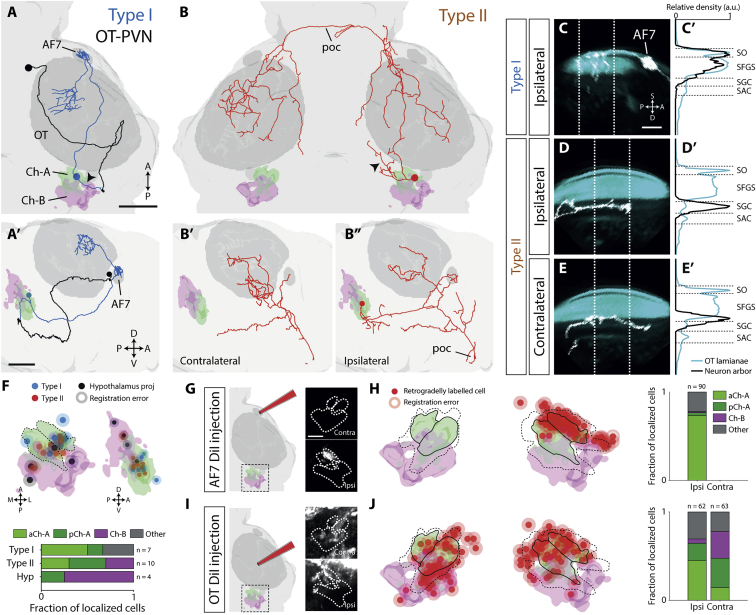
(A and B) Examples of a type I (A and A’) and a type II (B–B”) projection neuron that were labeled by electroporation. (A) also shows a photo-activated OT PVN neuron, projecting to isthmus (black). Neuronal tracings have been registered to the atlas and are overlaid with 3D-rendered masks displaying relevant brain areas. Top panels are dorsal views, and lower panels show lateral views. Black arrowheads indicate the putative dendrites of isthmic neurons. Scale bars, 50 μm.
(C–E’) Type I (C and C’) and type II (D–E’) axonal arborizations (white) in OT neuropil laminae (cyan). The imaging volume was rotated clockwise about the A-P axis ∼30° and then clockwise about the left-right (L-R) axis ∼40° to enable clearer visualization of the laminae. A density projection (C’, D’, and E’) along the superficial-deep tectal axis was taken over a volume that encompasses most of the axon arbors (60 μm). Dotted white lines delineate the area used to compute density profiles shown on the right (normalized to maximum). Scale bar, 25 μm.
(F) Localization of electroporated cells within isthmic domains. Top shows dorsal and lateral renderings of the Ch-A and Ch-B domains with registered locations of electroporated somata. Shading around each point represents mean registration uncertainty. Bottom quantifies localization of cell types across domains.
(G) Iontophoretic labeling of AF7. Schematic of DiI application is shown with insets showing the isthmus of a single registered brain with retrograde labeling in the ipsilateral aCh-A domain.
(H) Locations of retrogradely labeled somata following iontophoretic labeling of the right AF7 (n = 6 fish). Black lines show mean boundaries of aCh-A and pCh-A, and dotted lines show Ch-A maximum boundaries.
(I) Iontophoretic labeling of OT neuropil. Insets show retrograde labeling in both the ipsilateral and contralateral isthmus.
(J) Locations of labeled somata following iontophoretic labeling of the right OT neuropil (n = 10 fish).
A, anterior; AF7, arborization field 7; D, deep; OT, optic tectum; P, posterior; poc, post-optic commissure; S, superficial. See also