
|
Figure 3
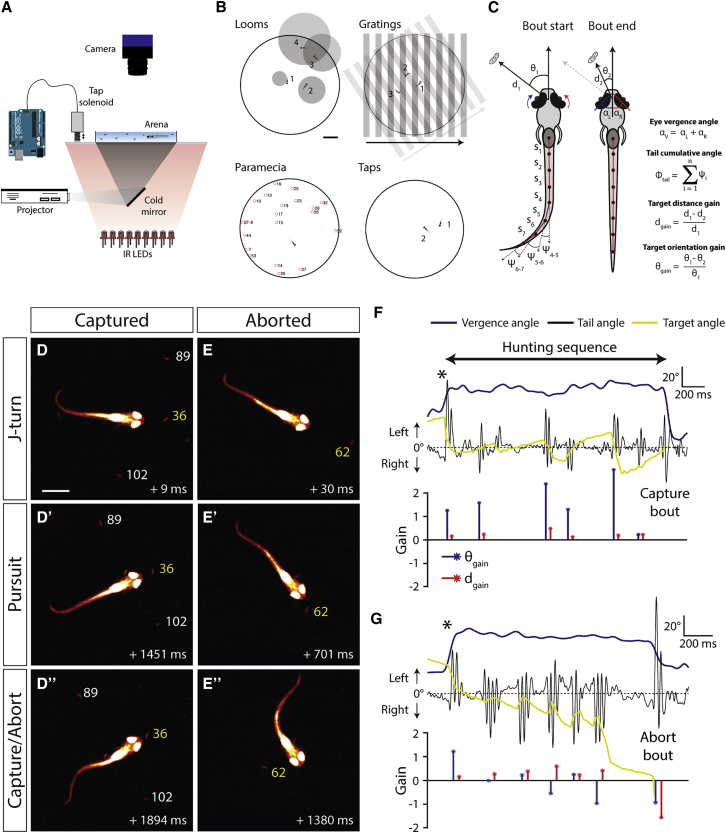
High-Speed Behavioral Tracking of Hunting Routines
(A) Experimental setup used for testing free-swimming behavior.
(B) Illustrations of stimuli presented to the larvae overlaid with video frames of resultant behavioral responses. For looming stimuli, video frames from stimulus onset: 1, +1 s; 2, +1.8 s; 3, +2.4 s; and 4, +2.7 s. For directional drifting gratings: 1, +1.3 s; 2, +2.7 s; and 3, +4 s. For solenoid-induced mechano-acoustic tap stimuli: 1, +0.1 s and 2, +0.17 s. For
(C) Schematic illustrating extraction of kinematic variables and hunting performance metrics. Distance and orientation gains are computed from changes between start and end of each swim bout in a hunting routine. For details, see
(D–D”) Video frames from a hunting routine that ended with a successful capture. The target
(E–E”) A hunting routine that was aborted. Frame timestamps are relative to time of hunting onset (convergent saccade).
(F) Behavioral kinematics for routine in (D). Black asterisk marks the convergent saccade at the beginning of the hunting routine. Lower plot shows gain values for each swim bout. In this case, distance and orientation gains are positive for all bouts.
(G) Data for the aborted hunting routine in (E). The final bout has negative distance and orientation gain, and vergence concurrently returns to baseline levels.