
|
Fig. S2
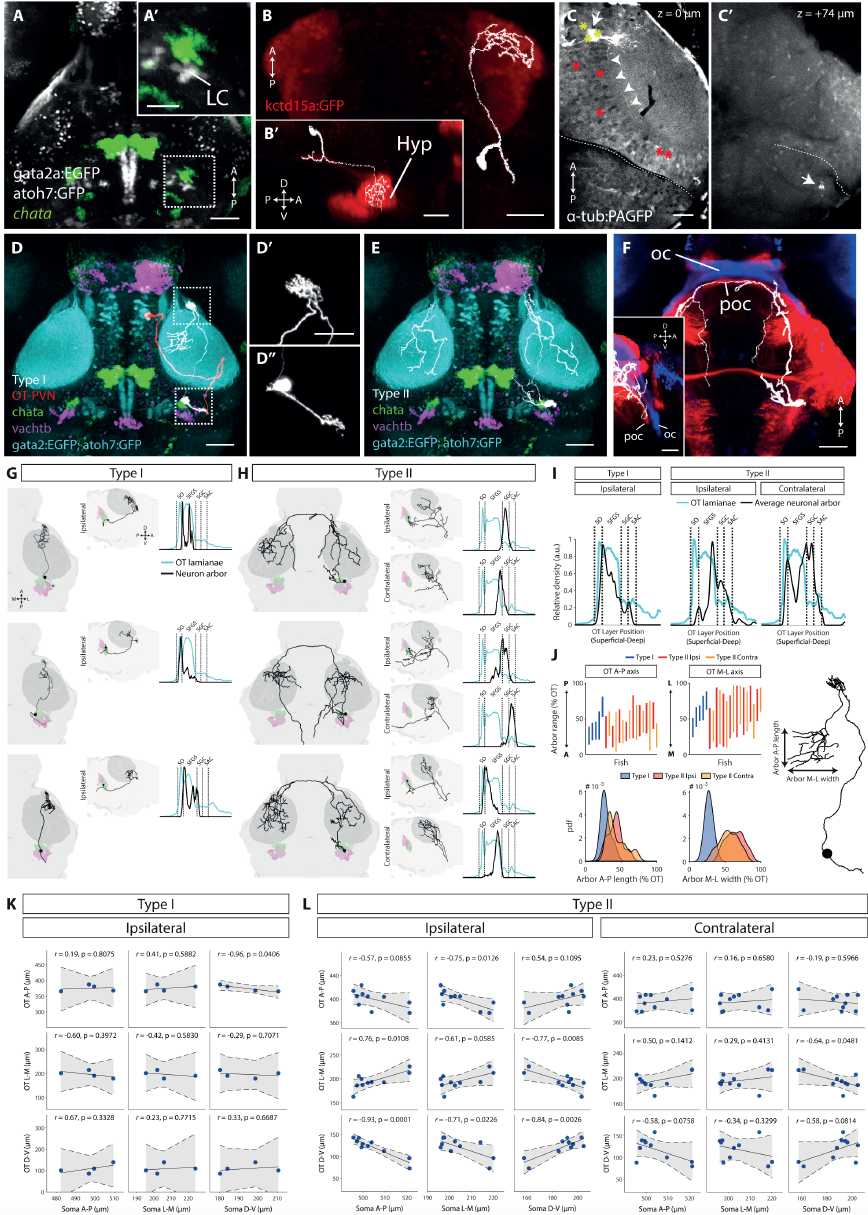
NI Type I and Type II neurons, related to Figure 2. (A) Et(gata2a:EGFP);Tg(atoh7:GFP) double transgenic used for electroporation of cells in the larval isthmus. Maximum intensity projection overlaid with registered chata expression. Scale bar, 50 mm. (A’) Isthmic region showing cells of the locus coeruleus (LC) in close proximity to chata expression. Scale bar, 25 mm. (B,B’) Electroporated neuron in the isthmic region projecting to the hypothalamus, labelled by kctd15a:GFP [S1]. (B’) shows lateral view. Scale bars, 50 mm. (C) Photo-activated PVNs in the rostral OT of a Tg(alpha tubulin:C3PA-GFP) larva. White arrow indicates location of photo-activation that resulted in labelling of several PVN somata. White arrowheads mark a single axon projecting from a photo-activated PVN. Yellow asterisks mark photo-activated regions in additional specimens that resulted in labelling of tectofugal projections to the ventrolateral anterior hindbrain, whereas red asterisks mark regions which did not. White dotted line indicates midbrain-hindbrain boundary. Scale bar, 25 mm. (C’) Terminal arbor (white arrow) of the axon in (C), located in the ventrolateral anterior hindbrain. Complete traced projection is shown in panel (D), Figure 2A and Video S1. (D) Registered tracing of Type I neuron (white) and photo-activated OT PVN (red), overlaid with relevant markers. Same example cells as Figure 2A. Scale bar, 50 mm. (D’,D”) Magnified views of AF7 arborization and presumptive dendrite in hindbrain. (E) Registered tracing of Type II neuron (white), shown also in Figure 2B. (F) Type II axon decussating through the post-optic commissure (poc), marked by expression of dbx1a:Gal4 (red). The optic chiasm (oc), is located more rostrally and marked by atoh7:GFP (blue). Scale bar, 50 mm. Inset: Lateral view. (G-H) Registered tracings of Type I and Type II neurons, along with density profiles showing axon terminal distributions across tectal laminae. (I) Mean tectal lamination density profiles for all traced Type I (n = 5) and Type II (n = 10) cells. (J) Size and locations of Type I and Type II terminal arbors in OT. Bottom panel shows the distribution of arbor length and width as a fraction of tectal length/width. (K-L) Analysis of topographic innervation of OT. Locations of electroporated Type I (n = 4) and Type II (n = 10) cell bodies are plotted against centroid locations of terminal arbors in OT. We only considered datasets where there was no sign of registration error in any region of the brain and therefore one traced Type I cell was excluded due to registration uncertainty in the isthmic hindbrain. Linear fits to the data are shown with 95% confidence bounds. r, Pearson’s correlation coefficient. Student’s t-test.