FIGURE

Figure 1

ID
ZDB-FIG-190723-828
Publication
Henriques et al., 2019 - Nucleus Isthmi Is Required to Sustain Target Pursuit during Visually Guided Prey-Catching
Other Figures
All Figure Page
Back to All Figure Page
Figure 1

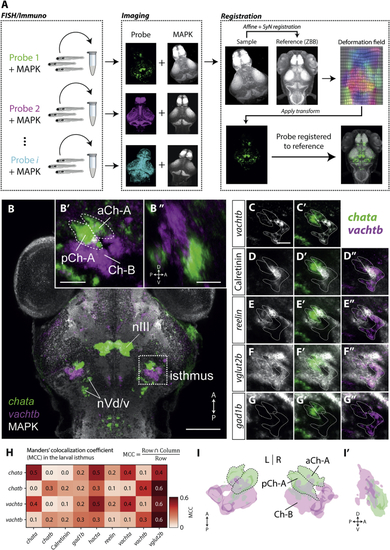
The Larval Zebrafish Isthmus Contains Two Cholinergic Gene Expression Domains

(A) Whole-brain registration pipeline. Fluorescent in situ hybridization for a target mRNA (probe) is combined with immunohistochemistry for MAPK on a separate fluorescence channel. Brain volumes are then imaged using 2-photon or confocal microscopy. For each brain, MAPK volumetric data (“sample”) are registered to the MAPK “reference” volume of ZBB. The computed deformation field is then applied to the probe channel to transform it into reference space, allowing in silico comparison of multiple expression patterns.

(B) Dorsal view showing expression of the cholinergic genes chata and vachtb across the brain. Each pattern represents a median of multiple registered single brains (n = 4; both) superimposed on the MAPK reference. Images show a maximum-intensity projection through focal planes encompassing the isthmus (90 μm). Scale bar, 100 μm. (B’ and B”) Enlarged view of isthmic region shows segregation of Ch-A and Ch-B domains. Scale bars, 25 μm.

(C–G”) In silico colocalization of molecular markers in the isthmus: vachtb (C and C’), Calretinin (D and D’’), reelin (E and E’’), vglut2b (F and F’’), gad1b (G and G’’). Dotted boundaries delineate aCh-A, pCh-A, and Ch-B regions. Images show the same single focal plane. In each row, the indicated marker is shown in gray and chata and vachtb are overlaid in green and magenta, respectively. Scale bar, 25 μm.

(H) Mander’s colocalization coefficient (MCC) quantifying overlap of markers in the larval isthmus. For each row marker, MCC represents the fraction of labeled voxels that coexpress the column marker. Values are means of pairwise comparisons across all specimens (Figure S1A).

(I) 3D rendering of cholinergic expression domains in the isthmus. (I’) Sagittal view of 3D rendering shows right isthmic region.

nIII, oculomotor nucleus; nVd/v, dorsal and ventral trigeminal nuclei. See also Figure S1.

Expression Data

Expression Detail
Antibody Labeling
Phenotype Data

Phenotype Detail
Acknowledgments
This image is the copyrighted work of the attributed author or publisher, and ZFIN has permission only to display this image to its users. Additional permissions should be obtained from the applicable author or publisher of the image. Full text @ Curr. Biol.