
- Title
-
Ultraspecific live imaging of the dynamics of zebrafish neutrophil granules by a histopermeable fluorogenic benzochalcone probe
- Authors
- Colucci-Guyon, E., Batista, A.S., Oliveira, S.D.S., Blaud, M., Bellettini, I.C., Marteyn, B.S., Leblanc, K., Herbomel, P., Duval, R.
- Source
- Full text @ Chem Sci
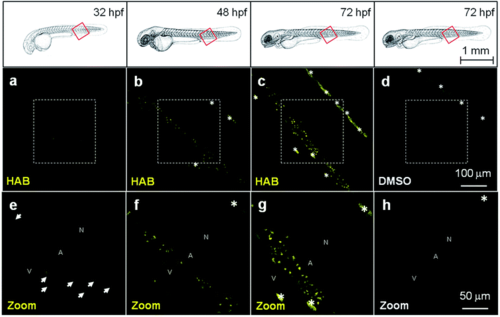
HAB labels specific cells in live zebrafish from 32 hpf. Confocal fluorescence imaging of HAB labeling (10 μM) in live wild-type zebrafish embryos (32 and 48 hpf) and swimming larvae (72 hpf) following excitation at 488 nm and detection in the 550–650 nm range. The yellow-orange color is indicative of the fluorescence seen with the naked eye. Maximum intensity Z-projection images (2 μm serial optical sections) are shown. Arrows point to the HAB label; asterisks mark pigment cells. A, artery; N, notochord; V, vein. |
|
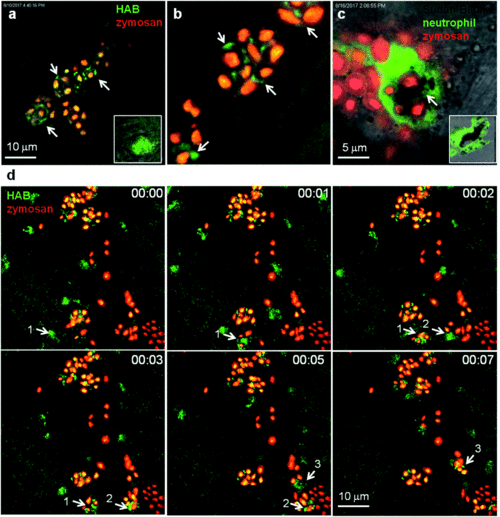
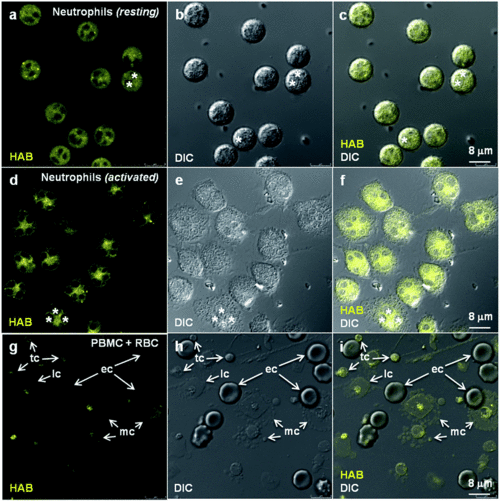
HAB reveals the dynamics of neutrophil granules upon phagocytosis of zymosan particles in live zebrafish. (a and b) Confocal live imaging of HAB-labeled neutrophil granules upon phagocytosis of subcutaneously injected zymosan in a live 72 hpf zebrafish larva under diffusion conditions. HAB is recruited to the forming phagosomes (arrows). Inset: HAB labeling of a resting neutrophil. (c) Sudan Black (SB) staining of myeloperoxidase-containing neutrophil granules showing granule recruitment to the phagosome upon zymosan phagocytosis in fixed zebrafish larvae. Inset: SB staining of a resting neutrophil; a single 1 μm optical section is shown. (d) Frames extracted from an in vivo time-lapse confocal imaging sequence (time step = 1 min). Arrows point to HAB-labeled neutrophil granules that are recruited to the nascent zymosan containing phagosome. Three neutrophils (pointed with number 1 to 3) were tracked during the time lapse sequence. Maximum intensity Z-projection (1 μm serial optical sections). See ESI for Video S8† related to (d). |
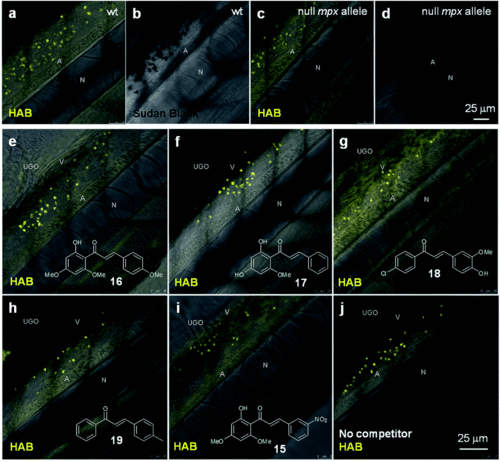
HAB does not target zebrafish neutrophil myeloperoxidase, and its binding to neutrophil granules is not a general feature of chalcones. (a and c) Merged confocal fluorescence and bright-field imaging of HAB (10 μM) in live wild-type (a) or “Spotless” (NL 144_01 mutant: null mpx allele) (c) 72 hpf zebrafish larvae following excitation at 488 nm and detection in the 550–650 nm range under diffusion conditions. (b and d) SB staining of myeloperoxidase-containing neutrophil granules in bright-field imaging. (e–j) Merged confocal fluorescence and bright-field imaging of HAB (10 μM) in live wild-type 72 hpf zebrafish larvae co-treated with chalcones 15, 16 (flavokawain A), 17(cardamonin), 18 or 19 (100 μM) following excitation at 488 nm and detection in the 550–650 nm range under diffusion conditions. The yellow-orange color is indicative of the fluorescence seen with the naked eye. Single 2 μm optical sections are shown. Abbreviations used: A (aorta); N (notochord); UGO (urogenital opening); V (vein). |
|