
- Title
-
Cellular responses to ionizing radiation change quickly over time during early development in zebrafish
- Authors
- Honjo, Y., Ichinohe, T.
- Source
- Full text @ Cell Biol. Int.
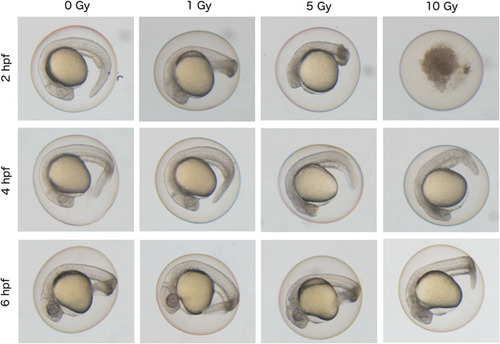
Differential effect of ionizing radiation on phenotypes of zebrafish embryos according to irradiated time‐points during early developmental stages. Zebrafish embryos at 24 hpf after irradiation at 2, 4, or 6 hpf with doses of 0, 1, 5, and 10 Gy of radiation. Non‐irradiated control embryos were shown in the left end panels (0 Gy). Whole embryos irradiated at 2 hpf (64‐cell stage) showed the most severe phenotype. At a dose of 10 Gy, embryos irradiated at 2 hpf were dead, whereas those at 4 hpf (blastula stage) or 6 hpf (gastrula stage) showed normal body shape. |

ZFIN is incorporating published figure images and captions as part of an ongoing project. Figures from some publications have not yet been curated, or are not available for display because of copyright restrictions. |
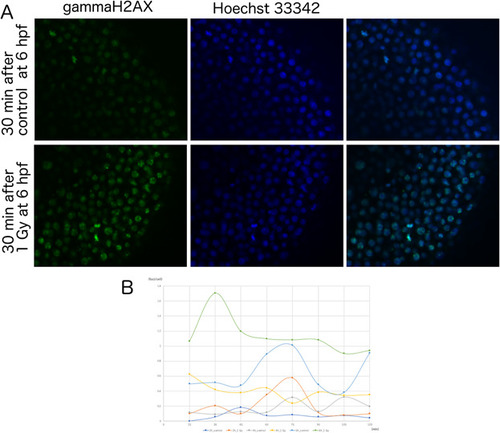
Formation of gamma‐H2AX foci in zebrafish embryos after irradiation at early developmental stages. (A) Fluorescein immunostaining images of anti‐γH2AX antibody (green, left panels), Hoechst 33342 (blue, middle panels) and merged images (right panels) in control embryos (upper panels) and 1 Gy‐irradiated embryos (lower panels) at 6 hpf. Irradiated samples showed γH2AX foci within nuclei, whereas controls have almost no γH2AX foci. (B) Embryos irradiated with 1 Gy at 2, 4, or 6 hpf were fixed at 15‐min intervals and stained with an anti‐γH2AX antibody. The numbers of foci per nuclei at each timepoint were plotted as: 2 hpf control (light blue) and 1 Gy irradiated (orange), 4 hpf control (yellow), and 1 Gy irradiated (blue) or 6 hpf control (dark blue) and 1 Gy irradiated (brown). Only the 6 hpf embryos irradiated at 1 Gy showed γH2AX foci formation. Foci numbers peaked at 30 min after irradiation. |
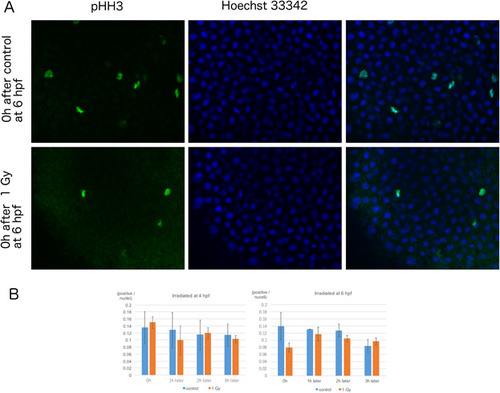
Effect of radiation exposure on M‐phase cells in zebrafish embryos at early developmental stages. (A) Immunostaining images of anti‐pHH3 antibody (green, left panels), Hoechst 33342 (blue, middle panels) and merged images (right panels) from embryos of 0 h after control (upper panels) or 1 Gy irradiation (lower panels) at 6 hpf. (B) Irradiated embryos were fixed at 1‐h intervals. The M‐phase marker, phospho‐histone H3 (phospho‐HH3) was detected by immunostaining; the ratio of positive cells/nuclei at each timepoint was calculated. In embryos irradiated at 4 hpf, the number of cells in M‐phase did not change compared to those in the control embryos (blue bars). However, cells irradiated at 6 hpf (orange bars) showed a reduction in M‐phase cells immediately after irradiation (P = 0.06). The columns and error bars represent the mean and SD, respectively. |
|
ZFIN is incorporating published figure images and captions as part of an ongoing project. Figures from some publications have not yet been curated, or are not available for display because of copyright restrictions. EXPRESSION / LABELING:
PHENOTYPE:
|
|
ZFIN is incorporating published figure images and captions as part of an ongoing project. Figures from some publications have not yet been curated, or are not available for display because of copyright restrictions. EXPRESSION / LABELING:
PHENOTYPE:
|
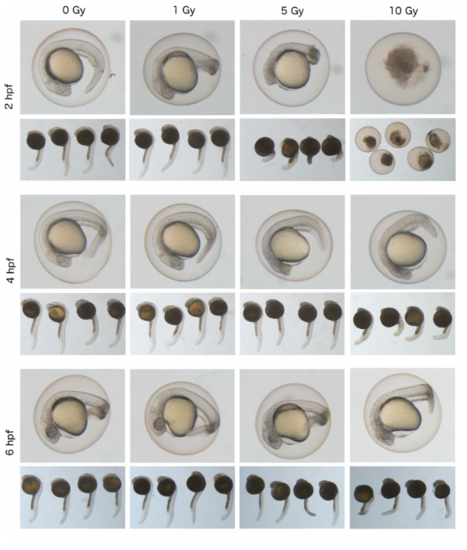
Images of pooled zebrafish embryos irradiated at 2, 4, or 6 hpf after irradiation with different doses (1, 5, and 10 Gy). |
Reprinted from Cell biology international, 43(5), Honjo, Y., Ichinohe, T., Cellular responses to ionizing radiation change quickly over time during early development in zebrafish, 516-527, Copyright (2019) with permission from Elsevier. Full text @ Cell Biol. Int.