
- Title
-
Neurotrophin receptor Ntrk2b function in the maintenance of dopamine and serotonin neurons in zebrafish
- Authors
- Sahu, M.P., Pazos-Boubeta, Y., Pajanoja, C., Rozov, S., Panula, P., Castrén, E.
- Source
- Full text @ Sci. Rep.
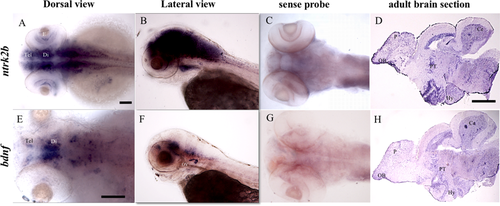
Comparative expression patterns of ntrk2b and bdnf transcripts by in-situ hybridization. (A,B) ntrk2b antisense expression at 3 dpf. Left is anterior side. (C) Sense probe for ntrk2b at 3 dpf. (D) ntrk2b expression in a 1-year-old adult brain section. Left is anterior side and top is dorsal. (E,F) bdnf expression in a larval brain at 3 dpf. Left is anterior side. (G) Sense probe for bdnf at 3 dpf. (H) bdnf expression in an adult brain section. Left is anterior side and top is dorsal. Tel - telencephalon, Di - diencephalon, E - eye, Hy - hypothalamus, Ce - cerebellum, PT - posterior tuberculum, P - pallium, OB - olfactory bulb. Scale bar = 100 µm.
EXPRESSION / LABELING:
|

Loss of ntrk2b had no major effect on gross morphology, however the levels of Ntrk protein and bdnf transcript were reduced. (A) Gross phenotypic difference between 6-month old age-matched wild-type and Ntrk2b mutant fish. (B) Ntrk2b exon 17 sequence matched with the mutant sequence suggesting the point mutation causes an abrupt stop codon. (C) Trk protein levels from age-matched adult wild-type, heterozygous and mutant brain samples analyzed using polyclonal anti-Trk antibody. (D) Relative intensity values normalized to actin levels and represented as percentage of control. (E) Amino acid alignment of human and zebrafish Ntrk with polyclonal Trk (SC-11) antibody sequence. (F) Comparative protein sequence analysis of both Ntrk2a and Ntrk2b. (G) Gross morphology of standard control-injected and MO-injected fish at 24 hours post injection. (H) Trk and actin western blots of 2 dpf old MO injected samples of different doses. (I) The bdnf transcript levels in the ntrk2b morphant are significantly reduced. (J) The p75ntr transcript levels in the morphant are unchanged. (K) tp53 levels are unchanged in the morphant. (L) A tp53 isoform delta 113 transcript is unaltered in the morphant. The y-axis for the Q-RT PCR represents relative expression levels normalized to b-actin. (Bars represent Mean ± SEM, **p = 0.0029, ***p = 0,0002, one-way ANOVA.Scale bar = 100 µm).
|
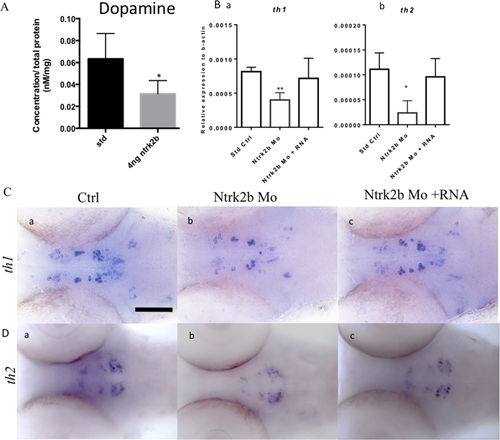
Effect of Ntrk2b deletion on dopamine and its markers at 3 dpf. (A) HPLC reveals total dopamine levels in the ntrk2b morphants at 3 dpf are reduced compared to controls. (B) (a,b) Dopaminergic neuron markers th1 and th2 transcripts were significantly reduced in the morphant. (C) (a–c) ISH of th1 revealed loss of expression in the diencephalon. This effect could be rescued with ntrk2b mRNA. (D) (a–c) The th2expression was reduced in all cell populations in the morphants. The y-axis for the Q-RT PCR represents relative expression levels normalized to b-actin. (Bars represent Mean ± SEM, Student t-test *p-value < 0.05. **p < 0.001 one-way ANOVA. Scale bar = 100 µm).
EXPRESSION / LABELING:
PHENOTYPE:
|
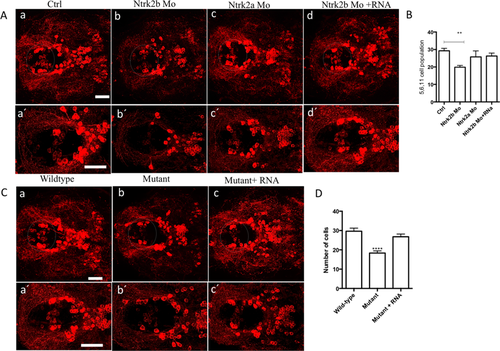
Reduced tyrosine hydroxylase immunoreactivity in both the morphants and mutants at 5 dpf. (A) (a–d) TH1 immunohistochemistry revealed a loss of the neuronal population in the diencephalic cluster (5,6,11 cell group) in the Ntrk2b and Ntrk2a morphant. The neuronal cell group affected has been encircled. (A) (a′–d′): Higher magnification images of the affected TH cell group. (B) Total cell counts in the diencephalic region of the morphants. (C) The mutants have reduced TH positive cells in the same cell group and could be rescued by mRNA overexpression. (C) (a′–d′) Higher magnification images of the affected TH cell group. (D) TH cell counts from the mutants in the 5,6,11 cell group. (Bars represent Mean ± SEM, one-way ANOVA, Kruskal-Wallis test **p-value < 0.008, ****p-value < 0.0002, Scale bar = 100 um).
|
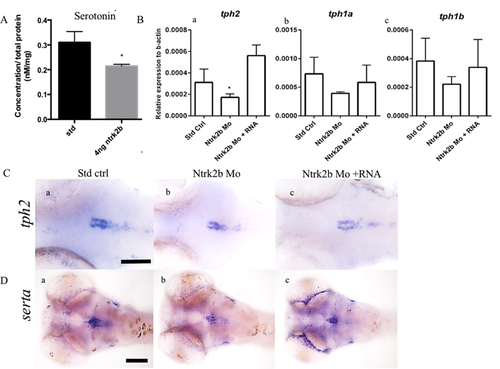
Loss of Ntrk2b effects on serotonin levels and its markers at 3 dpf. (A) Total serotonin levels were reduced in the morphants at 3 dpf. (B) The three TPH transcripts were analyzed in the morphants by QRT-PCR: Ba - tph2, Bb - tph1a, Bc - tph1b. (B) (a) Only tph2 was significantly reduced in the morphant and rescued by mRNA overexpression. (B) (b,c) The levels for tph1a and tph1b were unchanged. (C) (a–c) ISH with tph2 reveals reduced levels in the morphants. (D) (a–c) Expression of serta was observed in the raphe and pretectal cluster. Levels were reduced in the morphants. The y-axis for the Q-RT PCR represents relative expression levels normalized to b-actin. (Bars represent Mean ± SEM, Student t-test *p-value < 0.05, one-way ANOVA, Kruskal-Wallis test *p = 0.025, Scale bar = 100 µm).
EXPRESSION / LABELING:
PHENOTYPE:
|
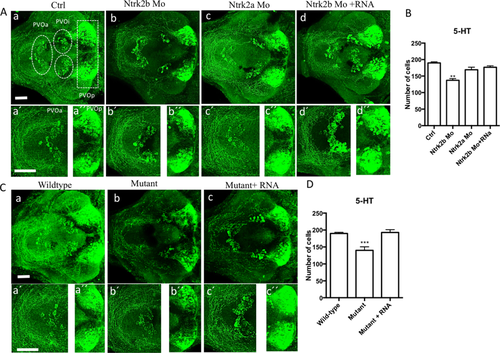
Immunoreactivity of serotonin was altered in the morphants and mutants at 5 dpf. (A) (a–d) Serotonin immunoreactivity was reduced in the morphant. (a) Ctrl. (b) Ntrk2b MO. (C) Ntrk2a MO and (d) Ntrk2b + mRNA. (B) Total serotonin positive cell counts shows significant reduction in the Ntrk2b MO. (A) (a′–d′) Higher magnification images of the PVOa and (A) (a′′–d′′) Higher magnification images of the PVOp. (C) The Ntrk2b mutants had reduced serotonin immunoreactivity as compared to wild-type littermates (a) wild-type, (b) Mutant, (c) Mutant injected with ntrk2b mRNA. The expression of 5-HT in the mutant is aberrant. (C) (a′–d′) Higher magnification images of the PVOa and (C) (a′′–d′′) Higher magnification images of the PVOp. (D) Comparative cell counts from the three groups representing reduced cell numbers in the mutant. PVOa – paraventricular organ, anterior part, PVOi – paraventricular organ, intermediate part, PVOp – paraventricular organ. (Bars represent Mean ± SEM, one-way ANOVA. **p-value < 0.002, ***p-value < 0.0004). Scale bar = 100 µm.
|
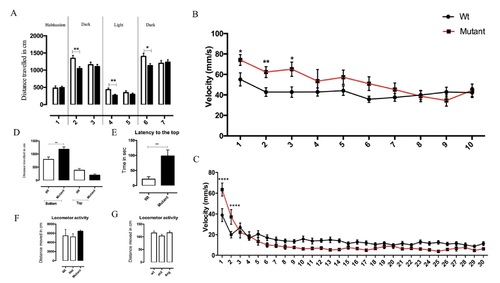
Anxiety-like behavior in Ntrk2b mutants. (A) Dark- light -dark activity test of 6 dpf Ntrk2b mutant larvae with 10 mins interval between the sessions. Each session was divided into blocks of two. (B) Acoustic startle responses of 6 dpf Wt and mutant larvae. (B) (a) Mean value of the maximum velocity during 10 stimuli with a 20 s ISI. (C) Analysis of acoustic startle response during 30 stimuli with a 1 s ISI. (D) Novel tank diving test using Ntrk2b adult mutants 9 months old. Distance travelled in the bottom of the tank by the mutant is significantly higher. (E) Latency to move to the top of the tank is higher in the mutants. (F) Locomotor activity of Ntrk2b adult mutants. (G) The locomotor activity of Ntrk2b morphants larvae. (Bars represent Mean ± SEM, two-way ANOVA with repeated measures: *p < 0.05, **p < 0.01, ***p < 0.001; ISI- inter stimulus interval). |