
- Title
-
Znfl1s are essential for patterning the anterior-posterior axis of zebrafish posterior hindbrain by acting as direct target genes of retinoic acid
- Authors
- Li, J., Zhao, Y., He, L., Huang, Y., Yang, X., Yu, L., Zhao, Q., Dong, X.
- Source
- Full text @ Mech. Dev.
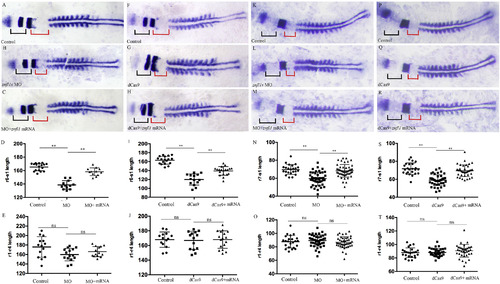
Knocking down znfl1s disturbs the development of posterior but not anterior part of zebrafish hindbrain. Flat-mount embryos at 11–12-somites stage are shown anterior left (A–C, F–H, K–M, P–R). The expression of en2a marks the hindbrain-mindbrian boundary (A–C, F–H, K–M, P–R). The expression of egr2b marks r3/r5 territory (A–C, F–H). The expression of mafba marks the r5/r6 (K–M, P–R). The expression of myod1 marks somite (A–C, F–H, K–M, P–R). At 11–12-somite stage, the lengths of r1–r4, r6–s1 and r7–s1 were measured from control embryos (A, F, K, P), znfl1s morphants (B, L), znfl1s MO plus znfl1 mRNA overexpressed embryos (C, M), dCas9-Eve knockdown embryos (G, Q) and dCas9-Eve plus znfl1 mRNA overexpressed embryos (H, R), respectively. The data about the lengths of r1–r4, r6–s1 or r7–s1 derived from A–C, F–H or K–M, P–R are shown in scatter plot diagrams D–E, I–J, N–O and S–T, respectively. The red line in A–C, F–H or in K–M, P–R shows the length of r6–s1 or r7–s1, respectively. The black line in A–C, F–H or in K–M, P–R shows the length of r1–r4. r, rhombmere; s1, the first somite. **: p < 0.01, ns: no significance.
EXPRESSION / LABELING:
PHENOTYPE:
|

Knocking down znfl1s reduces RA signaling in zebrafishembryos. Whole mount in situ hybridized embryos are positioned animal pole top (8 hpf, A–B) or anterior left (20 hpf, C–F). The expression of cyp26a1 was examined in controls (A, C) and znfl1s morphants (B) at 8 hpf or 20 hpf (D). The expressions of en2a, egr2b and hoxb4a in control embryos (E) and znfl1smorphants (F). All embryos were positioned in lateral view. The arrow points to the expression of hoxb4a in E–F.
EXPRESSION / LABELING:
PHENOTYPE:
|
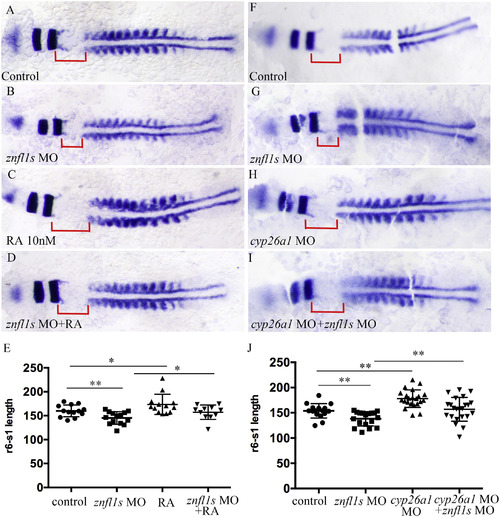
Increasing RA signaling rescues the defective posterior hindbrain of znfl1s morphants. Flat mount embryos at 11–12-somites stage are shown anterior left (A–D, F–I). At 11–12 somitestage, the length of r6-s1 were measured from the control embryos (A, F), znfl1s morphants (B, G), 10 nM RA treated embryos (C), znfl1s MO microinjected plus RA treated embryos (D), cyp26a1morphants (H), cyp26a1 MO plus znfl1s MO microinjected embryos (I). The data about the length of r6-s1 derived from A–D and F–I are shown in scatter diagrams E and J, respectively. The red line shows the length of r6-s1. **p < 0.01; * p < 0.05.
EXPRESSION / LABELING:
PHENOTYPE:
|
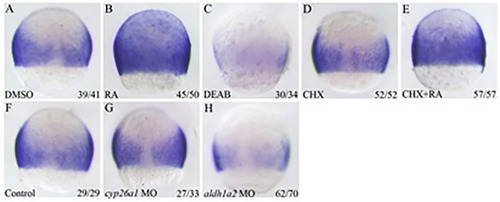
Zebrafish znfl1s are directly regulated by RA signaling in gastrula. The expressions of znfl1s were present in control embryos (A), RA treated embryos (B), DEAB treated embryos (C), CHX treated embryos (D), CHX combined with RA treated embryos (E), control MO microinjected embryos (F), cyp26a1knocked down embryos (G) and aldh1a2 knockdown embryos (H). All embryos were positioned in dorsal view, animal pole top. The number in the right-hand lower corner shows the number of embryos with the typical phenotype to that of total embryos examined.
EXPRESSION / LABELING:
PHENOTYPE:
|
Reprinted from Mechanisms of Development, 155, Li, J., Zhao, Y., He, L., Huang, Y., Yang, X., Yu, L., Zhao, Q., Dong, X., Znfl1s are essential for patterning the anterior-posterior axis of zebrafish posterior hindbrain by acting as direct target genes of retinoic acid, 27-33, Copyright (2018) with permission from Elsevier. Full text @ Mech. Dev.