
- Title
-
Live imaging of collagen deposition during skin development and repair in a collagen I - GFP fusion transgenic zebrafish line
- Authors
- Morris, J.L., Cross, S.J., Lu, Y., Kadler, K.E., Lu, Y., Dallas, S.L., Martin, P.
- Source
- Full text @ Dev. Biol.
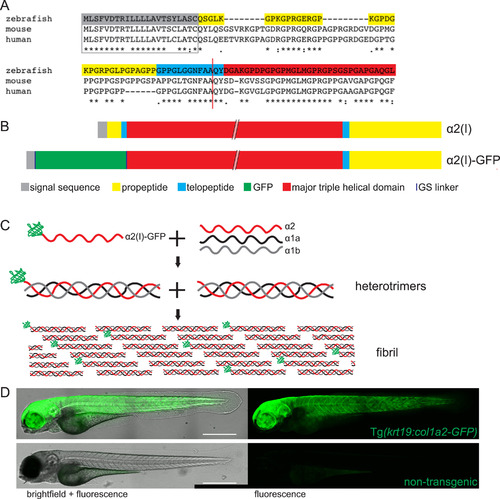
Generation of a GFP labelled collagen I zebrafish line. (A) The N-terminal regions of zebrafish, mouse and human collagen I α2 chains were aligned to determine the N-terminal proteinase cleavage site (red line) and identify the optimal GFP insertion site. (B) By inserting GFP in place of the N-terminal pro- and telo- peptide and removing the N-terminal proteinase site, GFP was retained on the α2 monomer. (C) GFP-tagged α2 trimerises with unlabelled α1a and α1b monomers and fibrillogenesis occurs with labelled and unlabelled trimers. (D) Tg(krt19:col1a2‐GFP) transgenic fish exhibit GFP labelling within flank skin when compared to control, non-transgenic zebrafish where only the gut shows faint autofluorescence. D is composed of a 4-image tilescan confocal image of a 4 dpf zebrafish. Scale bar = 0.5 mm. |
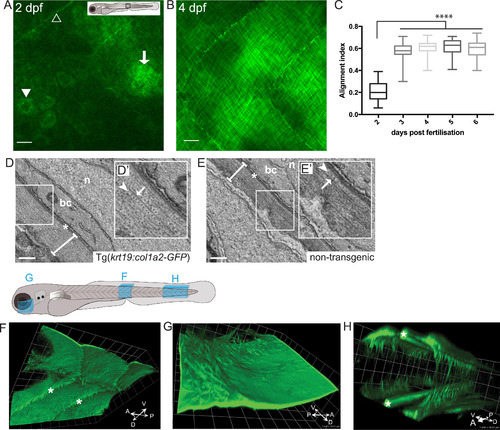
Imaging the deposition of collagen beneath the embryonic epidermis. (A) In the region of flank indicated by the box in larval schematic, the earliest GFP-collagen I is seen at 2 dpf in maximum projection confocal images of Tg(krt19:col1a2-GFP) transgenic zebrafish; GFP-collagen is seen within sporadic cells (arrowhead), and in some adjacent patches exhibiting the beginning of orthogonal patterning (arrow), as well as within myosepta (open arrowhead). (B) At 4 dpf orthogonal structure is fully evident. (C) Quantification of collagen alignment index (AI) over developmental time. Plotted as mean ± SD and analysed using a one-way ANOVA, ****p < 0.0001, n = 10–16 fish. (D, E) Transmission electron microscopy (TEM) of flank skin of 5 dpf Tg(krt19:col1a2-GFP) transgenic (D) and non-transgenic (E) larvae (with high magnification inset, D′, E′) reveals the orthogonal layering of collagen I; arrows indicate collagen fibril; arrowhead indicates adjacent orthogonal layer of collagen fibrils; n, nucleus; bc, basal cell cytoplasm; asterisk, basement membrane; line denotes collagen I layer. (F) GFP-collagen I tethers extend deep into the tissue of the 3 dpf fish as anchors to the underlying tissue within the myoseptum (asterisks); (G) Similarly, collagenous tethers link the epidermis to deep structures in the head, as for example around the eye; and (H) bilateral developing tail tendons are seen within the posterior-most portion of the developing tail (stars). Images in F, G and H are 3D reconstructions generated using Volocity, and correspond to regions indicated in the larval schematic above. Scale bars: A,B= 15 µm; C= 0.5 µm; F,G,H 1 unit= 18.51 µm; representative image of n = 3 fish imaged. |
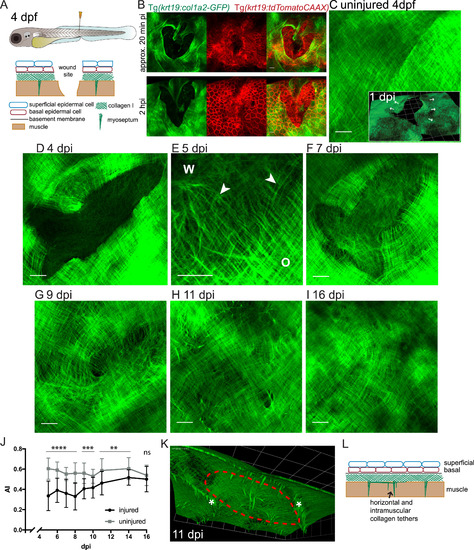
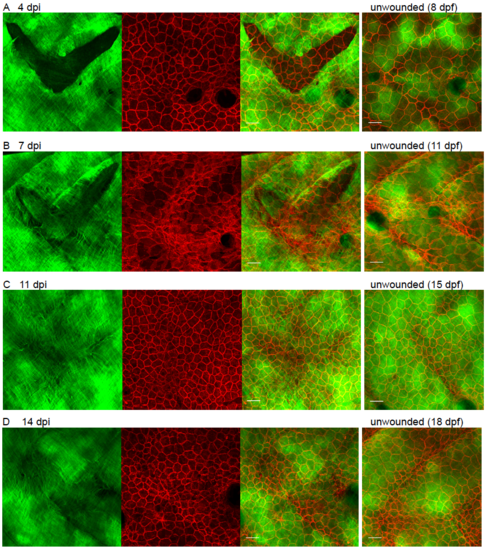
Observing collagen deposition/remodelling following skin wounding. (A) Schematic to illustrate the location/depth and tissues/layers involved in larval skin wounding. (B) Single and multi-channel images of wounds made to the flanks of Tg(krt19:col1a2-GFP), Tg(krt19:tdTomatoCAAX) double positive fish indicate how the epidermis (red cells) has partly healed in 20 min and completely healed over the denuded surface by 2 h post injury (hpi), whilst collagen I (green) remains absent in this region; see also Movie 1. (C-I) Max projection confocal images of Tg(krt19:col1a2-GFP) transgenic fish unwounded and wounded prior to imaging at the specified timepoints post injury (dpi); inset in C shows 3D reconstruction indicating collagen layer at 1 dpi with the collagen wound margin wrinkled where tension in this matrix meshwork has been released (arrows). E shows high magnification view of the interface between orthogonal (O) collagen, wound (W) margin and newly deposited wispy collagen fibrils (arrowheads) of a 5 dpi fish. (J) Quantification of collagen alignment index (AI) over the period of repair. For each timepoint mean of n = 7–12 wounds are plotted ± SD. ns, not significant, **p < 0.01, ***p < 0.001, ****p < 0.0001. (K) A 3D reconstructed, sub-epidermal view in the region of the repairing wound (red dotted line) indicates tethers extending both into muscle and between myosepta (asterisks). (L) Schematic to show tethers in addition to myosepta that remain at the healed wound site. For C-I Scale bars = 15 µm; inset in C and K, 1 unit= 24.68 µm. |
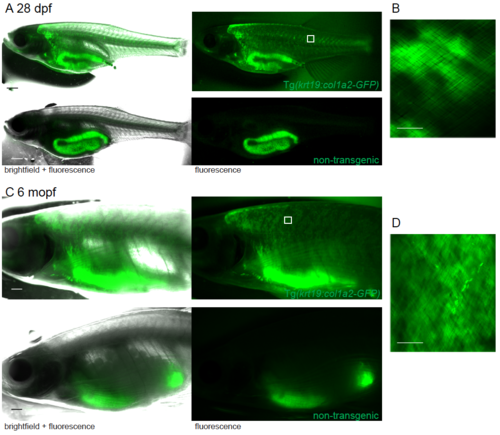
GFP expression in juvenile and adult GFP-collagen transgenic zebrafish. (A) Widefield bright field and fluorescent images of 28 dpf and (C) 6 month pf (mopf) GFP-collagen I fish showing they remain GFP positive, whereas only the gut is autofluorescent in non-transgenic fish. Region imaged by confocal indicated by white box. (B, D) Maximum projection confocal images demonstrate the GFP-collagen I is still orthogonal in nature, but it is located in the scale-layer. Scale bars: A = 1mm; B,D = 25 μm. |
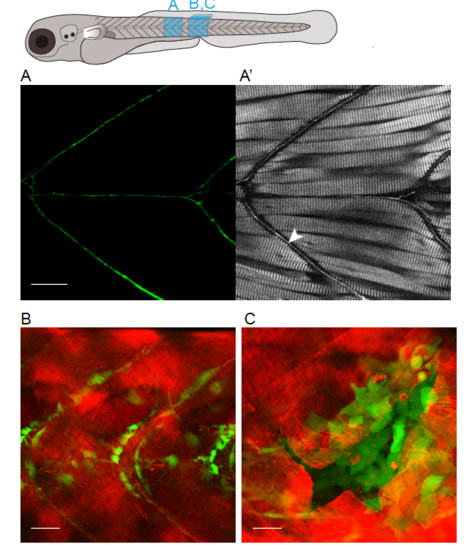
Epidermal-derived myoseptal collagen I structures and relationship of epidermal-derived mCherry-collagen I to invading ET37 fibroblast-like cells (A) Equivalent single z-plane confocal and SHG (A’) image of a 10 dpf Tg(krt19:col1a2-GFP) zebrafish, indicating myoseptal labelling (arrowhead in A’). (B,C) A maximum projection confocal images of Tg(krt19:col1a2-mcherry), ET37 double transgenic zebrafish to show relationship of epidermal-derived collagen I (red), with influx of fibroblasts-like cells (green) to wound, just prior to (B) and 2 dpi (C). Scale bars = 25 μm. |

Multiphoton imaging of developing tail tendon in 10 dpf GFPcollagen transgenic fish. (A) Maximum projection confocal image of GFPcollagen I transgenic zebrafish. (B) Maximum projection of forward second harmonic generation (SHG) microscopy image. Tail tendon indicated by arrowhead. (C) Maximum projection of backward SHG microscopy image. Developing actinotrichia in the tail fin are also labelled in B and C (but not A). (D) Overlay of GFP, forward and backward SHG. |
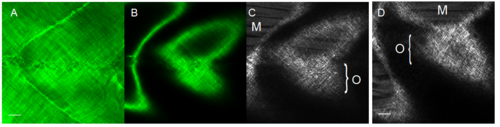
Comparing fluorescent images of GFP-collagen I transgenic fish versus Second Harmonic Generation (SHG) imaging. (A) A maximum projection confocal image and (B) single z-plane image of a 10 dpf GFP-collagen I transgenic fish directly compared to a single z-plane signal from a second harmonic generation (SHG) microscopy image of the same fish (C). (D) A single zplane SHG microscopy image of a non-transgenic zebrafish. M, muscle fibres; O, orthogonal collagen fibrils. Scale bar = 15 μm. |
Migration of epidermal cells versus epidermal collagen I deposition post wounding. Still images from repairing wounds to the flanks of 4 dpf Tg(krt19:col1a2-GFP), Tg(krt19:tdTomatoCAAX) double transgenic fish to reveal relative time course of repair of the cellular versus matrix layers. Scale bar = 25 μm. |
Reprinted from Developmental Biology, 441(1), Morris, J.L., Cross, S.J., Lu, Y., Kadler, K.E., Lu, Y., Dallas, S.L., Martin, P., Live imaging of collagen deposition during skin development and repair in a collagen I - GFP fusion transgenic zebrafish line, 4-11, Copyright (2018) with permission from Elsevier. Full text @ Dev. Biol.