
Image
|
Figure Caption
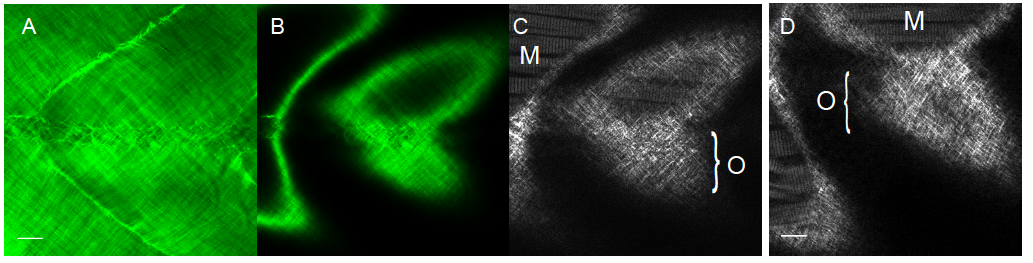
Fig. S5
Comparing fluorescent images of GFP-collagen I transgenic fish versus Second Harmonic Generation (SHG) imaging.
(A) A maximum projection confocal image and (B) single z-plane image of a 10 dpf GFP-collagen I transgenic fish directly compared to a single z-plane signal from a second harmonic generation (SHG) microscopy image of the same fish (C). (D) A single zplane SHG microscopy image of a non-transgenic zebrafish. M, muscle fibres; O, orthogonal collagen fibrils. Scale bar = 15 μm.
Acknowledgments
This image is the copyrighted work of the attributed author or publisher, and
ZFIN has permission only to display this image to its users.
Additional permissions should be obtained from the applicable author or publisher of the image.
Reprinted from Developmental Biology, 441(1), Morris, J.L., Cross, S.J., Lu, Y., Kadler, K.E., Lu, Y., Dallas, S.L., Martin, P., Live imaging of collagen deposition during skin development and repair in a collagen I - GFP fusion transgenic zebrafish line, 4-11, Copyright (2018) with permission from Elsevier. Full text @ Dev. Biol.