
- Title
-
Up-regulation of golgi α-mannosidase IA and down-regulation of golgi α-mannosidase IC activates unfolded protein response during hepatocarcinogenesis
- Authors
- Tu, H.C., Hsiao, Y.C., Yang, W.Y., Tsai, S.L., Lin, H.K., Liao, C.Y., Lu, J.W., Chou, Y.T., Wang, H.D., Yuh, C.H.
- Source
- Full text @ Hepatol Commun
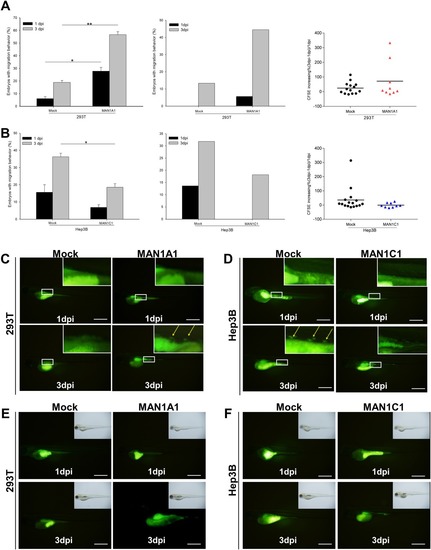
In vivo xenotransplantation assay for different cell lines and MAN1A1‐ or MAN1C1‐overexpressing cells. The cell lines were labeled with a DiI or CFSE fluorescent dye and injected into the yolks of 2‐day‐old zebrafish embryos. (A) Left: In vivo migration ability of embryos injected with MAN1A1 stably overexpressing or control 293T cells. DiI‐labeled MAN1A1 stably overexpressing cells increased the migration ability compared to the DsRed control cells (Mock) at 1 and 3 days postinjection (MAN1A1, n = 37; Mock, n = 48). Middle: Transient CFSE‐labeled MAN1A1‐overexpressing cells increased the migration ability (MAN1A1, n = 18; Mock, n = 15). Right: Proliferation ability of embryos injected with MAN1A1‐overexpressing 293T cells analyzed by area using Image J; MAN1A1‐overexpressing 293T cells increased the proliferation ability compared to the Mock 293T cells at 1 and 3 days postinjection. The data are presented as dot plots with a horizontal line for the mean. (B) Left: In vivo migration ability from the embryos injected with stably MAN1C1‐overexpressing Hep3B cells. MAN1C1 stably overexpressing cells decreased the migration ability compared to the Mock Hep3B cells. (MAN1C1, n = 95; Mock, n = 155). Middle: CFSE‐labeled MAN1C1 transiently overexpressing cells decreased the migration ability (MAN1C1, n = 11; Mock, n = 22). Right: Proliferation ability of embryos injected with MAN1C1‐overexpressing Hep3B cells decreased the proliferation ability compared to the Mock Hep3B cells at 1 and 3 days postinjection. The data are presented as dot plots with a horizontal line for the mean. (C) Representative images of MAN1A1 transiently overexpressing 293T cells increased the migration ability compared to the Mock 293T cells at 1 and 3 days postinjection. (D) Representative images of MAN1C1 transiently overexpressing Hep3B cells decreased the migration ability compared to the Mock Hep3B cells. (E) Representative images of MAN1A1 transiently overexpressing 293T cells increased the proliferation ability compared to the Mock 293T cells at 1 and 3 days postinjection. (F) Representative images of MAN1C1 transiently overexpressing Hep3B cells decreased the proliferation ability compared to the Mock Hep3B cells at 1 and 3 days postinjection. The xenotransplantation experiments were repeated 4 times. The images were taken at magnification ×48; scale shown is for 1 mm. Abbreviation: dpi, dots per inch.
|
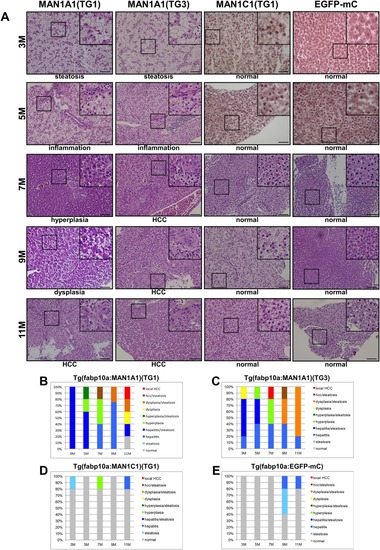
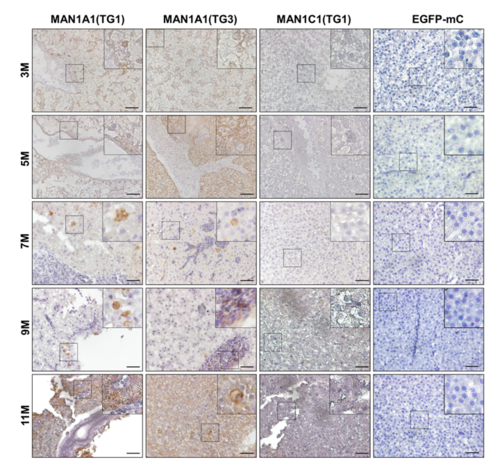
Histopathological analysis of hepatocytes in MAN1A1 and MAN1C1 transgenic fish at 3, 5, 7, 9, and 11 months of age. (A) Hematoxylin and eosin staining of liver sections from the TG1 and TG3 independent lines of MAN1A1 and MAN1C1(TG1) transgenic fish. Hematoxylin and eosin staining of the liver sections from MAN1A1 transgenic fish showed various pathological features, such as steatosis, inflammation, hyperplasia, dysplasia, and HCC. The MAN1C1 transgenic fish and EGFP‐mCherry control fish revealed normal phenotypes. The images were taken at magnification ×400, and scale shown is for 30 μm. (B) Statistical analysis of MAN1A1 (TG1), (C) MAN1A1 (TG3), (D) MAN1C1 (TG1), and (E) Tg(fabp10a:EGFP‐mCherry) is shown; n = 5 for each stage of transgenic fish.
|
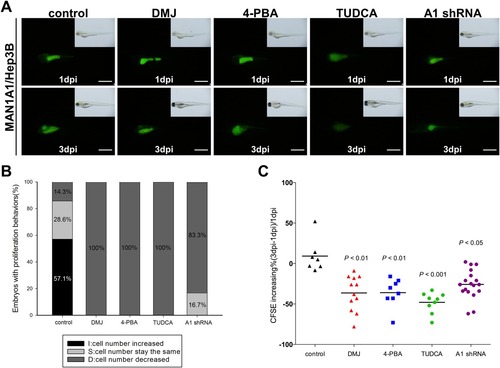
In vivo xenotransplantation assay for different inhibitors or MAN1A1 shRNA treatment in MAN1A1‐overexpressing cells. The cell lines were labeled with a CFSE florescent dye and injected into the yolks of 2‐day‐old zebrafish embryos. (A) Representative images of 1 day postinjection versus 3 days postinjection of MAN1A1 transiently overexpressing Hep3B cells treated with sterile water, DMJ, 4‐PBA, TUDCA, and MAN1A1 shRNA are shown from the same fish at 1 day postinjection and 3 days postinjection. (B) The percentage of embryos with increased, no change, or decreased number of injected CFSE‐dyed cells was analyzed using Image J and compared between 3 days postinjection and 1 day postinjection. (C) The proliferation ability of MAN1A1 transiently overexpressing Hep3B cells was effectively inhibited by the mannosidase inhibitors, ER stress inhibitor, and MAN1A1 shRNA. The data are presented as dot plots with a horizontal line for the mean. Experiments were repeated 3 times. Statistical significance was calculated using the Student t test (*P < 0.05, **P < 0.01, ***P < 0.001). Images were taken at magnification ×48, and the scale shown is for 1 mm. Abbreviation: dpi, dots per inch.
|
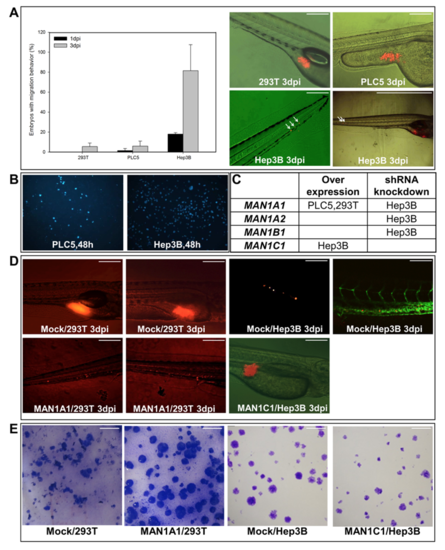
In vivo Xenotransplantation Assay for Different Cell Lines and Stable MAN1A1- or MAN1C1-overexpressing cells. (A) Three cell lines (293T, PLC5, and Hep3B) were labeled with a DiI fluorescent dye and injected into the yolk sac of 2-day-old zebrafish embryos. The embryos with cell migration behavior was recorded at 1 and 3 dpi (day-post-injection). Left: At 3dpi, the embryos with cell migratory behavior constituted 5.5% and 6% of those injected with non-cancerous 293T cells and PLC5 cells; however, 81.5% of the embryos exhibited migratory behavior when injected with the hepatoma cell line Hep3B. Right: Representative images showed the migration behavior of the injected cells in zebrafish embryos. The images were taken at 100X magnification (except the lower right panel is at 40X) and scale shown is for 1 mm. (The figures are results of triplicate experiments. 293T:n=98; PLC5:n=59; Hep3B:n=44) (B) In vitro migration assay of PLC5 and Hep3B showed lower transwell migration ability of PLC5 compared to Hep3B. (C) The cells listed for overexpression and shRNA knockdown of specific isoform of α-1,2 mannosidase gene. (D) Left: Representative images showed stably overexpressing MAN1A1 cells and DsRed vector control cells (Mock) injected into zebrafish embryos. Right: Representative images exhibited stably overexpressing MAN1C1 cells and mock cells injected into zebrafish embryos. The images were taken at 100X magnification and scale shown is for 1 mm. (E) Colony formation assay images for stably MAN1A1 overexpressing 293T cells and mock 293T cells. (F) Colony formation assay images for stably MAN1C1 overexpressing Hep3B cells and mock Hep3B cells. The images in Fig S1E and S1F were taken at 100X magnification and the scale shown is for 50mm. |

Examination of the Progression of Hepatocarcinogenesis in MAN1A1 and MAN1C1 Overexpressing Transgenic and WT Fish by Oil Red O and Sirius Red Staining. Frozen liver sections were used for staining (A) The signal present in MAN1A1 overexpressing transgenic fish starts at 3M but not in MAN1C1 transgenic fish and EGFP-mCherry control fish as measured by Oil Red O staining. (B) For Sirius Red staining, the signal in MAN1A1 overexpressing transgenic fish started at 3M and increased by 5M. In contrast, all MAN1C1 overexpressing transgenic fish and EGFP-mCherry control fish are normal. The images were taken at 400X magnification and the scale shown is 30 μm. N=5 each stage per transgenic line. |
Examination of the Expression of the UPR mediator BiP in Transgenic Fish Overexpressing MAN1A1 and MAN1C1 by IHC Staining. IHC was performed on liver sections from different fish ages (3M to 11M). The BiP signal present in MAN1A1 overexpressing transgenic fish starts at 3M but is little in MAN1C1 transgenic fish, and almost undetectable in EGFP-mCherry control fish. These images were taken at 400X magnification and the scale shown is 30 μm. N=5 each stage per transgenic line. |