
Fig. S1
- ID
- ZDB-FIG-180530-1
- Publication
- Tu et al., 2017 - Up-regulation of golgi α-mannosidase IA and down-regulation of golgi α-mannosidase IC activates unfolded protein response during hepatocarcinogenesis
- Other Figures
- All Figure Page
- Back to All Figure Page
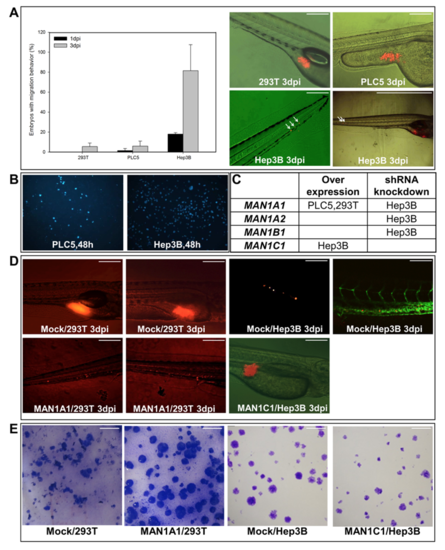
In vivo Xenotransplantation Assay for Different Cell Lines and Stable MAN1A1- or MAN1C1-overexpressing cells. (A) Three cell lines (293T, PLC5, and Hep3B) were labeled with a DiI fluorescent dye and injected into the yolk sac of 2-day-old zebrafish embryos. The embryos with cell migration behavior was recorded at 1 and 3 dpi (day-post-injection). Left: At 3dpi, the embryos with cell migratory behavior constituted 5.5% and 6% of those injected with non-cancerous 293T cells and PLC5 cells; however, 81.5% of the embryos exhibited migratory behavior when injected with the hepatoma cell line Hep3B. Right: Representative images showed the migration behavior of the injected cells in zebrafish embryos. The images were taken at 100X magnification (except the lower right panel is at 40X) and scale shown is for 1 mm. (The figures are results of triplicate experiments. 293T:n=98; PLC5:n=59; Hep3B:n=44) (B) In vitro migration assay of PLC5 and Hep3B showed lower transwell migration ability of PLC5 compared to Hep3B. (C) The cells listed for overexpression and shRNA knockdown of specific isoform of α-1,2 mannosidase gene. (D) Left: Representative images showed stably overexpressing MAN1A1 cells and DsRed vector control cells (Mock) injected into zebrafish embryos. Right: Representative images exhibited stably overexpressing MAN1C1 cells and mock cells injected into zebrafish embryos. The images were taken at 100X magnification and scale shown is for 1 mm. (E) Colony formation assay images for stably MAN1A1 overexpressing 293T cells and mock 293T cells. (F) Colony formation assay images for stably MAN1C1 overexpressing Hep3B cells and mock Hep3B cells. The images in Fig S1E and S1F were taken at 100X magnification and the scale shown is for 50mm. |