
FIGURE
Fig. 1
- ID
- ZDB-FIG-180529-65
- Publication
- Tu et al., 2017 - Up-regulation of golgi α-mannosidase IA and down-regulation of golgi α-mannosidase IC activates unfolded protein response during hepatocarcinogenesis
- Other Figures
- All Figure Page
- Back to All Figure Page
Fig. 1
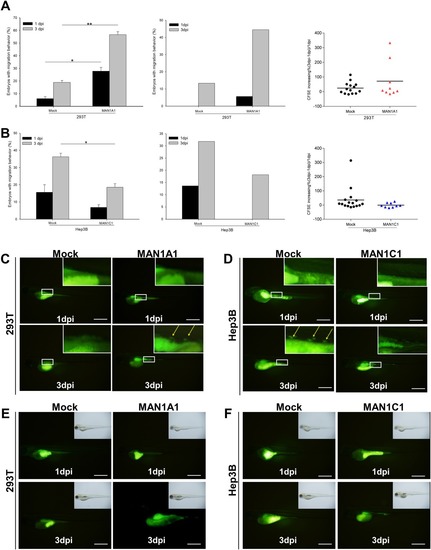
In vivo xenotransplantation assay for different cell lines and MAN1A1‐ or MAN1C1‐overexpressing cells. The cell lines were labeled with a DiI or CFSE fluorescent dye and injected into the yolks of 2‐day‐old zebrafish embryos. (A) Left: In vivo migration ability of embryos injected with MAN1A1 stably overexpressing or control 293T cells. DiI‐labeled MAN1A1 stably overexpressing cells increased the migration ability compared to the DsRed control cells (Mock) at 1 and 3 days postinjection (MAN1A1, n = 37; Mock, n = 48). Middle: Transient CFSE‐labeled MAN1A1‐overexpressing cells increased the migration ability (MAN1A1, n = 18; Mock, n = 15). Right: Proliferation ability of embryos injected with MAN1A1‐overexpressing 293T cells analyzed by area using Image J; MAN1A1‐overexpressing 293T cells increased the proliferation ability compared to the Mock 293T cells at 1 and 3 days postinjection. The data are presented as dot plots with a horizontal line for the mean. (B) Left: In vivo migration ability from the embryos injected with stably MAN1C1‐overexpressing Hep3B cells. MAN1C1 stably overexpressing cells decreased the migration ability compared to the Mock Hep3B cells. (MAN1C1, n = 95; Mock, n = 155). Middle: CFSE‐labeled MAN1C1 transiently overexpressing cells decreased the migration ability (MAN1C1, n = 11; Mock, n = 22). Right: Proliferation ability of embryos injected with MAN1C1‐overexpressing Hep3B cells decreased the proliferation ability compared to the Mock Hep3B cells at 1 and 3 days postinjection. The data are presented as dot plots with a horizontal line for the mean. (C) Representative images of MAN1A1 transiently overexpressing 293T cells increased the migration ability compared to the Mock 293T cells at 1 and 3 days postinjection. (D) Representative images of MAN1C1 transiently overexpressing Hep3B cells decreased the migration ability compared to the Mock Hep3B cells. (E) Representative images of MAN1A1 transiently overexpressing 293T cells increased the proliferation ability compared to the Mock 293T cells at 1 and 3 days postinjection. (F) Representative images of MAN1C1 transiently overexpressing Hep3B cells decreased the proliferation ability compared to the Mock Hep3B cells at 1 and 3 days postinjection. The xenotransplantation experiments were repeated 4 times. The images were taken at magnification ×48; scale shown is for 1 mm. Abbreviation: dpi, dots per inch.
|
Expression Data
Expression Detail
Antibody Labeling
Phenotype Data
Phenotype Detail
Acknowledgments
This image is the copyrighted work of the attributed author or publisher, and
ZFIN has permission only to display this image to its users.
Additional permissions should be obtained from the applicable author or publisher of the image.
Full text @ Hepatol Commun