
FIGURE
Fig. 6
- ID
- ZDB-FIG-180529-66
- Publication
- Tu et al., 2017 - Up-regulation of golgi α-mannosidase IA and down-regulation of golgi α-mannosidase IC activates unfolded protein response during hepatocarcinogenesis
- Other Figures
- All Figure Page
- Back to All Figure Page
Fig. 6
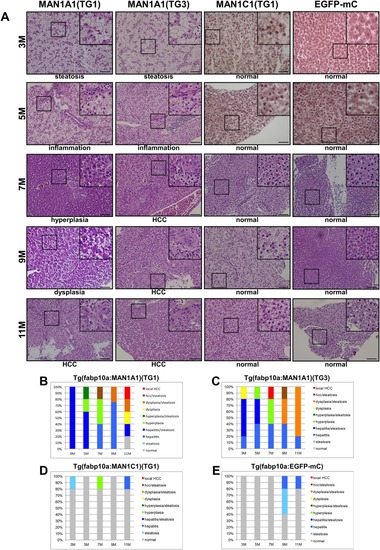
Histopathological analysis of hepatocytes in MAN1A1 and MAN1C1 transgenic fish at 3, 5, 7, 9, and 11 months of age. (A) Hematoxylin and eosin staining of liver sections from the TG1 and TG3 independent lines of MAN1A1 and MAN1C1(TG1) transgenic fish. Hematoxylin and eosin staining of the liver sections from MAN1A1 transgenic fish showed various pathological features, such as steatosis, inflammation, hyperplasia, dysplasia, and HCC. The MAN1C1 transgenic fish and EGFP‐mCherry control fish revealed normal phenotypes. The images were taken at magnification ×400, and scale shown is for 30 μm. (B) Statistical analysis of MAN1A1 (TG1), (C) MAN1A1 (TG3), (D) MAN1C1 (TG1), and (E) Tg(fabp10a:EGFP‐mCherry) is shown; n = 5 for each stage of transgenic fish.
|
Expression Data
Expression Detail
Antibody Labeling
Phenotype Data
| Fish: | |
|---|---|
| Observed In: | |
| Stage: | Adult |
Phenotype Detail
Acknowledgments
This image is the copyrighted work of the attributed author or publisher, and
ZFIN has permission only to display this image to its users.
Additional permissions should be obtained from the applicable author or publisher of the image.
Full text @ Hepatol Commun