
- Title
-
MicroRNA-27b Depletion Enhances Endotrophic and Intravascular Lipid Accumulation and Induces Adipocyte Hyperplasia in Zebrafish
- Authors
- Hsu, C.C., Lai, C.Y., Lin, C.Y., Yeh, K.Y., Her, G.M.
- Source
- Full text @ Int. J. Mol. Sci.
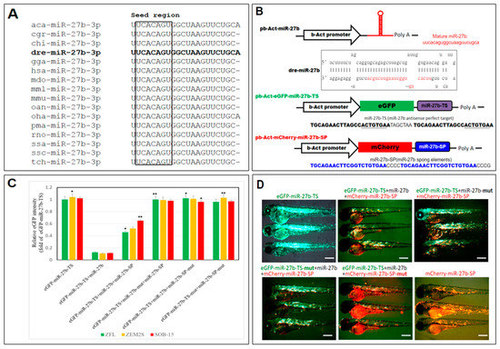
Design and validation of a miR-27b-sponge (miR27b-SP). (A) Alignment of the mature miR-27b sequence is perfectly conserved across many species, including arboreal lizard (Anolis carolinensis; aca-miR-27b), chinese hamster (Cricetulus griseus; cgr-miR-27b), domestic goat (Capra hircus; chi-miR-27b), zebrafish (Danio rerio; dre-miR-27b), red junglefowl (Gallus gallus; gga-miR-27b), humans (Homo sapiens; hsa-miR-27b), gray short-tailed opossum (Monodelphis domestica; mdo-miR-27b), rhesus macaque (Macaca mulatta; mml-miR-27b), mouse (Mus musculus; mmu-miR-27b), platypus (Ornithorhynchus anatinus; oan-miR-27b), king cobra (Ophiophagus hannah; oha-miR-27b), sea lamprey (Petromyzon marinus; pma-miR-27b), rat (Rattus norvegicus; rno-miR-27b), Atlantic salmon (Salmo salar; ssa-miR-27b), wild boar (Sus scrofa; ssc-miR-27b) and chinese tree shrew (Tupaia chinensis; tch-miR-27b). (B) Cloning of pri-miR-27b and miR27b-SP into b-Act expression vectors. Stem-loop structure of premiR-27b is shown, in which mature miR-27b is highlighted in red. (C) In vitro EGFP reporter assays were performed to confirm the direct interaction between miR-27b and the target sequences. ZFL, ZEM2S, and SOB-15 cells were transfected with indicated b-Act-miR-27b plasmids, and the EGFP intensity was measured. * p < 0.01, and ** p < 0.005. (D) In vivo EGFP reporter assays were performed to confirm the direct interaction between miR-27b and the target sequences in six days post fertilization (dpf) zebrafish larvae.
|
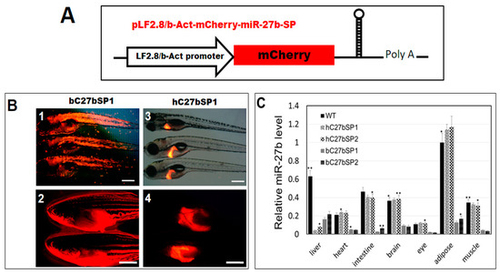
Generation of miR27b-SP transgenic zebrafish. (A) Cloning of pri-miR-27b and miR27b-SP into LF2.8 or b-Act expression vectors. (B) Red fluorescent images of miR27b-SP expression in the entire body of bC27bSP1 (panel 1, 9 dpf, 40× magnification, scale bars: 200 µm; panel 2, 4 months post fertilization (mpf), 40× magnification, scale bars: 100 mm) and the livers of hC27bSP1 (3, 9 dpf; 4, 4 mpf, 40× magnification, scale bars: 100 mm). (C) Stem-loop RT-qPCR analysis of mature miR-27b of the liver, heart, intestine, brain, eye, adipose and muscle tissues from the four transgenic lines, bC7aSPs (bC27bSP1,2) and hC7aSPs (hC27bSP1,2). n = 5–8 for each groups. * p < 0.01, and ** p < 0.005.
|
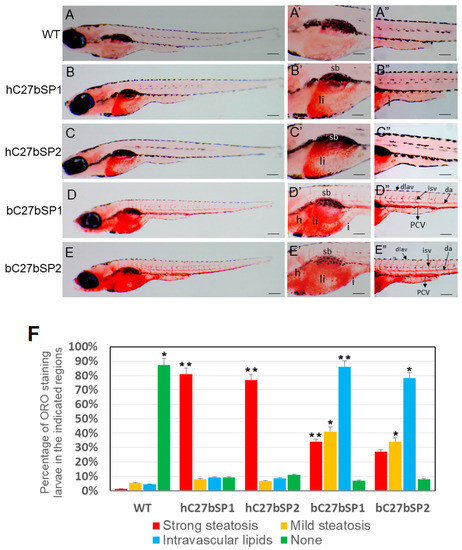
Effect of miR27b-SP on hC27bSPs and bC7aSPs liver and intravascular lipids through Oil Red O (ORO) staining. (A–E) Lateral view of the whole-mount ORO staining of representative larvae fed with high-fat diet (HFD) (40× magnification, scale bars: 200 µm). Enlargement at the trunk and posterior level is shown in panels ′ and ″ (110× magnification, scale bars: 100 µm). (F) The percentages of hC27bSPs and bC27bSPs larvae with steatosis and intravascular lipids was calculated through ORO staining. The ORO staining was performed in triplicate with on average 60–80 larvae per groups. The asterisk represents statistically significant differences; * p < 0.01, and ** p < 0.005. Abbreviations: e, eye; da, dorsal aorta; dlav, dorsal longitudinal anastomotic vessel; h, heart; i, intestine; isv, intersegmental vessel; PCV, posterior cardinal vein; sb, swim bladder; and ys, yolk sac.
PHENOTYPE:
|
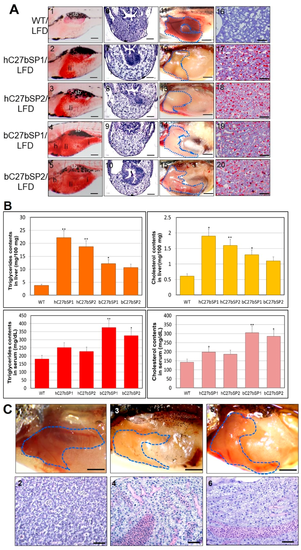
NAFLD and NASH phenotypes observed in hC27bSPs and bC27bSPs adults. (A) Liver histological changes of C27bSPs larvae at different quantities of feeding and lipid contents. The ORO staining in the liver of C27bSPs larvae fed with low-fat diet (LFD) for WT (panel 1), hC7aSPs (panels 2 and 3) and bC7aSPs (panels 4 and 5). 110X magnification, scale bars: 100 µm. The histological changes in the liver of zebrafish larvae fed with LFD for WT (panel 6), hC7aSPs (panels 7 and 8), and bC7aSPs (panels 9 and 10), 400× magnification, scale bars: 10 µm. Representative gross anatomy of the liver of 4-month-old WT (panel 11), hC7aSPs (panels 12 and 13) and bC7aSPs (panels 14 and 15) adults. 40× magnification, scale bars: 50 mm. Lipid accumulation was confirmed through ORO-stained sections from adult WT (panel 16), hC7aSPs (panels 17 and 18) and bC7aSPs (panels 19 and 20). 400× magnification, scale bars: 25 µm. (B) Comparison of lipid contents (liver and serum triglycerides and cholesterol) in the 11-month-old hC27bSPs and bC27bSPs adults. (n = 4–6 for each groups). * p < 0.01, and ** p < 0.005. (C) Representative gross anatomy images of the 11-month-old WT (panel 1), hC27bSP1 (panel 3) and hC27bSP2 (panel 5) livers. 40× magnification, scale bars: 50 mm. H&E staining of the 11-month-old WT (panel 2), hC7aSP1 (panel 4) and hC7aSP2 (panel 6) livers, demonstrating induced liver stress and damage in hC27bSPs compared with WT at the same stage. 400× magnification, scale bars: 50 µm. (D) Levels of hepatic MDA, and H2O2 in hepatic mitochondria was compared with hC27bSPs, bC27bSPs, and WT adults fed a LFD for four weeks. (E) Expression of endoplasmic reticulum (ER) stress markers, atf6, ern2, ire1, prek, hspa5, grp78, and ddit3 (up) and inflammatory genes, il-1b, il-6, tnf-α, ifn-γ, nfkb2, and NF-kB, is increased (down). The qRT-PCRs were performed in triplicate. Expression analysis of the selected genes using cDNA prepared from average four months male–female fish pairs per groups. Values were normalized against β-actin. The asterisk represents statistically significant differences; * p < 0 .01, and ** p < 0.005 levels as compared to control.
PHENOTYPE:
|
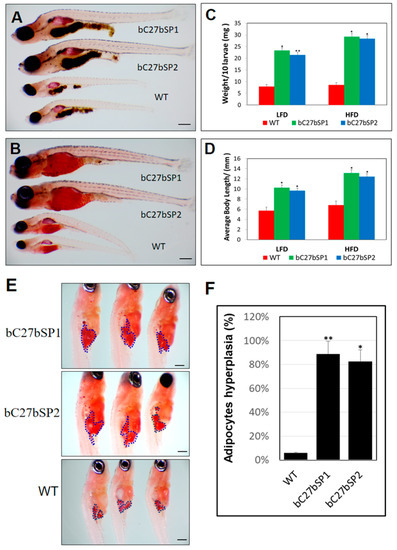
miR-27b depletion results in enhancement of bC27bSPs larval growth and adipocyte formation. (A) Representative images of bC7aSPs and WT larvae fed a HFD and (B) fed a LFD, 40× magnification, scale bars: 200 µm. (C) Average body weights of bC27bSPs and WT larvae fed a LFD or HFD (n = 40–50 for each groups). * p < 0.01, and ** p < 0.005. (D) Average body lengths of bC27bSPs and WT larvae fed a LFD or HFD (n = 40–50 for each groups). * p < 0.01, and ** p < 0.005. (E) ORO-stained visceral adipocytes in bC27bSPs when compared to WT controls at 24 dpf. Visceral adipocytes are circled. 110× magnification, scale bars: 200 µm. (F) The percentage of bC27bSPs and WT larvae containing hyperplasia of visceral adipocytes (n = 40–50 for each groups). * p < 0.01, and ** p < 0.005.
PHENOTYPE:
|
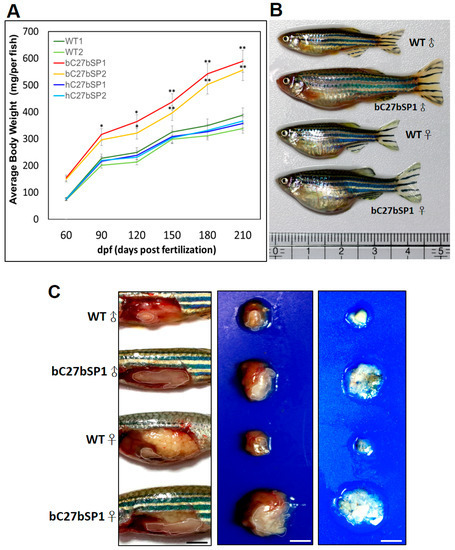
miR-27b depletion induces weight gain and increases fat mass in adult bC7aSPs. (A) bC27bSPs, hC27bSPs and WT were fed a HFD for 210 days. Serial body weight of each zebrafish was monitored monthly (n = 20–25). * p < 0.01, and ** p < 0.005. (B) Representative images of male and female bC27bSP1 and WT fed either a HFD for five months. (C) miR-27b depletion leads to greater abdominal fat (left), larger internal organs (middle) and the increased intra-abdominal fat pad size is shown (right). Adipose tissues are circled. 40× magnification, scale bars: 25 mm (D) Expression of adipogenic genes and proteins in abdominal fat of WT and bC27bSP1. PPAR-γ, C/EBP-β, and SREBP-1c mRNA (left, qRT-PCR) and proteins (right, western blot). * p < 0.01, and ** p < 0.005.
|