
FIGURE
Fig. 5
- ID
- ZDB-FIG-180504-20
- Publication
- Hsu et al., 2017 - MicroRNA-27b Depletion Enhances Endotrophic and Intravascular Lipid Accumulation and Induces Adipocyte Hyperplasia in Zebrafish
- Other Figures
- All Figure Page
- Back to All Figure Page
Fig. 5
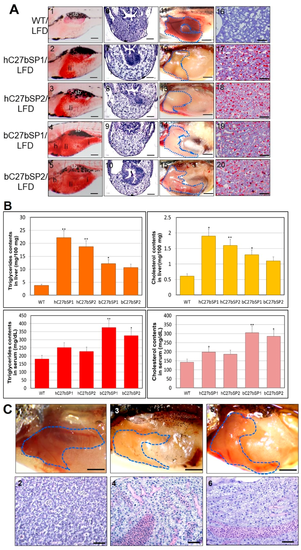
NAFLD and NASH phenotypes observed in hC27bSPs and bC27bSPs adults. (A) Liver histological changes of C27bSPs larvae at different quantities of feeding and lipid contents. The ORO staining in the liver of C27bSPs larvae fed with low-fat diet (LFD) for WT (panel 1), hC7aSPs (panels 2 and 3) and bC7aSPs (panels 4 and 5). 110X magnification, scale bars: 100 µm. The histological changes in the liver of zebrafish larvae fed with LFD for WT (panel 6), hC7aSPs (panels 7 and 8), and bC7aSPs (panels 9 and 10), 400× magnification, scale bars: 10 µm. Representative gross anatomy of the liver of 4-month-old WT (panel 11), hC7aSPs (panels 12 and 13) and bC7aSPs (panels 14 and 15) adults. 40× magnification, scale bars: 50 mm. Lipid accumulation was confirmed through ORO-stained sections from adult WT (panel 16), hC7aSPs (panels 17 and 18) and bC7aSPs (panels 19 and 20). 400× magnification, scale bars: 25 µm. (B) Comparison of lipid contents (liver and serum triglycerides and cholesterol) in the 11-month-old hC27bSPs and bC27bSPs adults. (n = 4–6 for each groups). * p < 0.01, and ** p < 0.005. (C) Representative gross anatomy images of the 11-month-old WT (panel 1), hC27bSP1 (panel 3) and hC27bSP2 (panel 5) livers. 40× magnification, scale bars: 50 mm. H&E staining of the 11-month-old WT (panel 2), hC7aSP1 (panel 4) and hC7aSP2 (panel 6) livers, demonstrating induced liver stress and damage in hC27bSPs compared with WT at the same stage. 400× magnification, scale bars: 50 µm. (D) Levels of hepatic MDA, and H2O2 in hepatic mitochondria was compared with hC27bSPs, bC27bSPs, and WT adults fed a LFD for four weeks. (E) Expression of endoplasmic reticulum (ER) stress markers, atf6, ern2, ire1, prek, hspa5, grp78, and ddit3 (up) and inflammatory genes, il-1b, il-6, tnf-α, ifn-γ, nfkb2, and NF-kB, is increased (down). The qRT-PCRs were performed in triplicate. Expression analysis of the selected genes using cDNA prepared from average four months male–female fish pairs per groups. Values were normalized against β-actin. The asterisk represents statistically significant differences; * p < 0 .01, and ** p < 0.005 levels as compared to control.
|
Expression Data
Expression Detail
Antibody Labeling
Phenotype Data
| Fish: | |
|---|---|
| Condition: | |
| Observed In: | |
| Stage Range: | Days 21-29 to Adult |
Phenotype Detail
Acknowledgments
This image is the copyrighted work of the attributed author or publisher, and
ZFIN has permission only to display this image to its users.
Additional permissions should be obtained from the applicable author or publisher of the image.
Full text @ Int. J. Mol. Sci.