
- Title
-
Single-cell functional and chemosensitive profiling of combinatorial colorectal therapy in zebrafish xenografts
- Authors
- Fior, R., Póvoa, V., Mendes, R.V., Carvalho, T., Gomes, A., Figueiredo, N., Ferreira, M.G.
- Source
- Full text @ Proc. Natl. Acad. Sci. USA
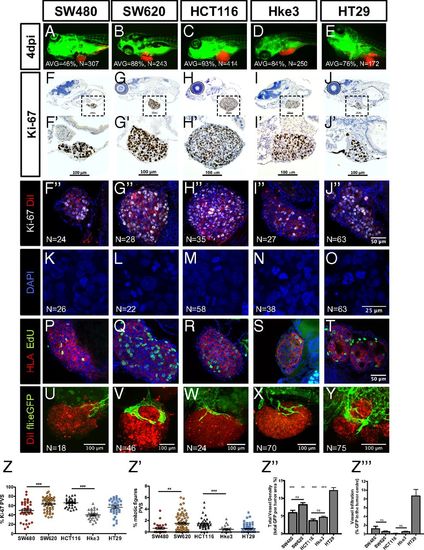
Implantation and histological analysis of human CRC zebrafish-xenografts. Human CRC cells (SW480; SW620; HCT116; Hke3 and HT29) were labeled with DiI dye (red) and injected into the PVS of 48-hpf zebrafish. At 4 dpi, the number of xenografts with a tumor implanted was quantified (A–E), and the average (AVG) implantation rate was determined from at least three independent experiments. Immunohistochemistry for Ki-67 in paraffin sections at 4-dpi xenografts (F–J′). Images were obtained using a Zeiss AxioScan Z1, generating tiled images. Note that a fine line of agarose inclusion might be detected around the xenograft due to the agarose embedding step prior to paraffin inclusion. Whole-mount immunofluorescence staining at 4 dpi, for Ki-67 (F′′–J′′). Representative images of mitotic figures in the corresponding xenografts (K–O), nuclei staining with DAPI in blue, anti-human HLA in red and EdU staining in green (P–T). Quantification of percentage of Ki-67 positive cells per xenograft (Z, ***P < 0.0001) and mitotic figures (Z′, ***P < 0.0001) in corresponding tumors (each dot represents one xenograft). Human CRC xenografts were generated in Tg(fli:eGFP) zebrafish to visualize blood vessels. Images representative of 4 dpi xenografts induced neovasculature: SW480 (U); SW620 (V); HCT116 (W); Hke3 (X) and HT29 xenografts (Y). Quantification of total vessel density (Z′′) and vessel infiltration (Z′′′); **/*** refers to comparison with HT29. HT29 tumors displayed significantly higher vessel density and infiltration than any other tumor, SW480 vs. HT29 (P = 0.0264); SW620 vs. HT29 (P = ns); HCT116 vs. HT29 (P < 0.0001); and Hke3 vs. HT29 (P < 0.0001). Infiltration potential SW480 vs. HCT116 (P = 0.0482); SW480 vs. HT29 (P = 0.0025); HCT116 vs. HT29 (P < 0.0001). Results in Z, Z′, Z′′, and Z′′′ are expressed as average (AVG) ± SEM. The number of xenografts analyzed for Ki-67; mitotic index and angiogenesis is indicated in the figures. All images in the same row are at the same magnification. *P < 0.05; **P < 0.005; ns, nonsignificant. EXPRESSION / LABELING:
|
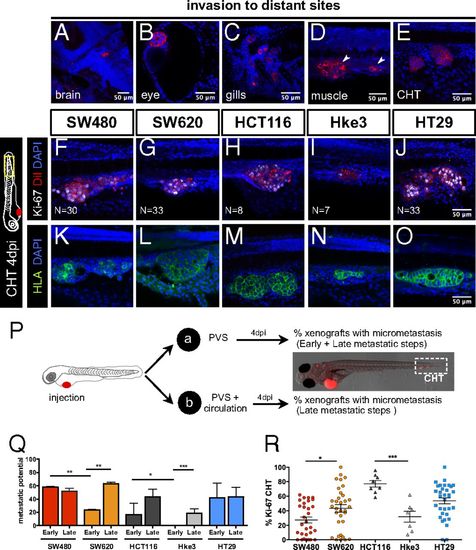
Human CRC cells show different metastatic potential. At 4 dpi, it is possible to detect human tumor cells throughout the zebrafish body, in the brain (A), eye (B), gills (C), muscle (D), and CHT (E). Immunofluorescence for Ki-67 (F–J) and anti-human HLA (K–O) in the CHT region at 4 dpi in the indicated xenografts. To distinguish between early and late metastatic steps, tumor cells were injected into the PVS only (group_a) or in the PVS and directly into circulation (group_b) (P). Quantification of Early (EMP) and Late (LMP) Metastatic Potential (Q) and percentage of Ki-67 positive cells in the CHT micrometastasis (R); each dot represents one xenograft. Results are averages from at least three independent experiments. The number of xenografts analyzed for Ki-67 is indicated in the images. The number of xenografts analyzed for EMP and LMP are as follows: SW480 (EMP, n = 62; LMP, n = 66); SW620 (EMP, n = 50; LMP, n = 69); HCT116 (EMP, n = 73; LMP, n = 57); Hke3 (EMP, n = 74; LMP, n = 250); HT29 (EMP, n = 31; LMP, n = 94) (Q). Results in Q and R are expressed as AVG ± SEM. Nuclei staining with DAPI is in blue. All pictures in the same row (F–O) are at the same magnification. All images are anterior to the left, posterior to right, dorsal up, and ventral down. *P < 0.05; **P < 0.005; ***P < 0.0001. |
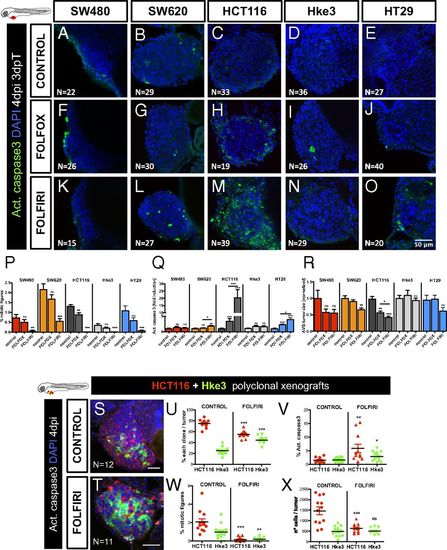
CRC xenografts show different sensitivities to standard chemotherapy. Human CRC zebrafish xenografts were treated in vivo with FOLFOX (F–J) and FOLFIRI (K–O) compared with nontreated controls (A–E). Zebrafish were killed and fixed at 4 dpi, 3 days posttreatment (3 dpT). Mitotic index (P) (DAPI in blue) and cell death by apoptosis (Q) (activated caspase3 in green) were analyzed and quantified. Average tumor size (number of DAPI cells), normalized to respective controls, was also quantified to compare between different xenografts in different conditions (R). All pictures are at the same magnification (A–O). Results in P–R are expressed as AVG ± SEM. Results are averages from at least three independent experiments, and the total number of xenografts analyzed is indicated in the images; ns, nonsignificant; P values are indicated in the text, ***P < 0.001. HCT116 and Hke3 polyclonal xenografts (1:1) were generated and randomly treated with FOLFIRI (T) and compared with untreated controls (S). Xenografts were fixed at 4 dpi, 3 dpT. The percentages of each clone (U), cell death by apoptosis (V) (activated caspase3), mitotic index (W), and the size of each clone per xenograft (X), were analyzed and quantified. Each dot represents a xenograft, Hke3_caspase3 **P = 0.041, Hke3_mitosis **P = 0.006, remaining P values are indicated in the text, and *P < 0.05; **P < 0.005; ***P < 0.001. The total number of xenografts analyzed is indicated in the images. HCT116 was labeled with DiI (red) and Hke3 with DeepRed (green, false color). |
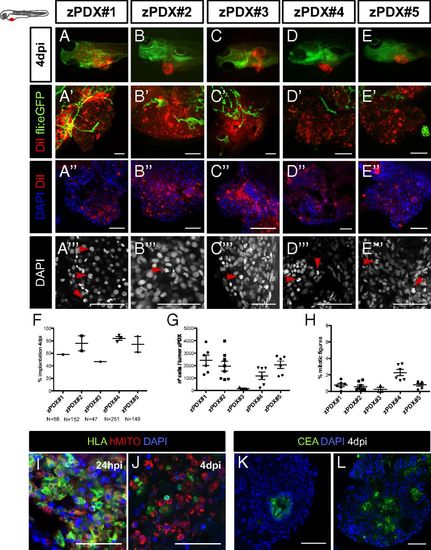
The zPDX can be efficiently established using human CRC primary samples. Cell suspensions derived from surgically resected human colon tumors were labeled with the lipophilic DiI dye (red) and injected into the PVS of 48-hpf wt or Tg(fli:EGFP). At 4 dpi, the number of zebrafish with an implanted tumor was quantified (A–F) (each dot represents the implantation percentage of each experiment). Representative confocal images of 4-dpi zPDX showing neovasculature in Tg(fli:EGFP) (A′–E′) and tumor masses with high cytomorphologic and architectural diversity (DAPI) (A′′–E′′). The number of nuclei (tumor size) (G) and mitotic figures (H) in these tumor masses was quantified; each dot represents one xenograft. Representative images of mitotic figures (A′′′–E′′′) (red arrows) and corresponding quantification (H). HLA and human mitochondria-immunostained cells at 24 hpi (I) and 4 dpi (J). Tubular structures with luminal CEA staining (K and L). (Scale bar, 50 μm.) *P < 0.05; **P < 0.005; ***P < 0.0001; ns, nonsignificant. EXPRESSION / LABELING:
|
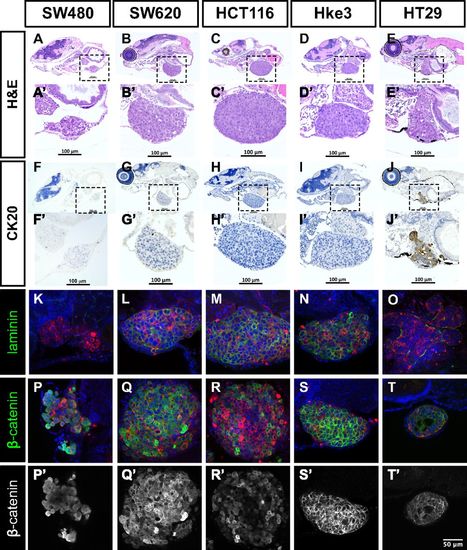
Histological analysis of human CRC zebrafish xenografts. Hematoxylin eosin staining (A–E′) and immunohistochemistry for CK20 (F–J′) were performed in histological sections, and corresponding images were obtained using a Zeiss AxioScan Z1, generating tiled images. Note that a fine line of agarose inclusion might be detected around the xenograft due to the agarose embedding step prior to paraffin inclusion. Whole-mount imunofluorescence staining for laminin (K–O) and β-catenin (P–T′). All imunofluorescence images are at the same magnification. (Scale bar, 50 μm.) DiI is in red, and nuclei staining with DAPI is in blue. Dashed boxes indicate areas of zoom. All images are anterior to the left, posterior to right, dorsal up, and ventral down. |
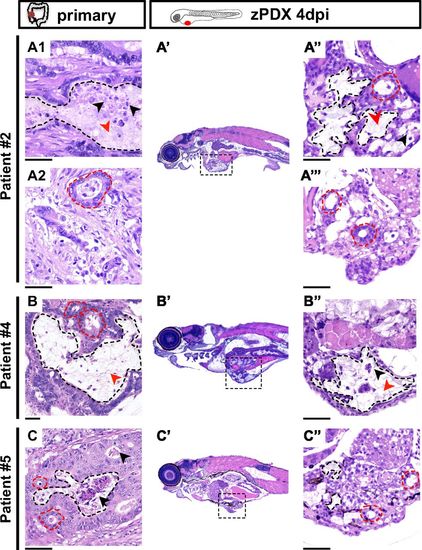
The zPDX conserve basic histological features of the original tumors. Representative microphotographs of parental tumors: patient #2 (A1 and A2), patient#4 (B), patient#5 (C), and their matching zebrafish PDX (A′–A′′′, B′ and B′′, and C′ and C′′). A′, B′, and C′ are a low magnification of a representative zPDX, showing localization of the tumor mass in the abdominal cavity. A′′, A′′′, B′′, and C′′ are higher magnifications of different tumors. Black dashed lines delineate mucin lakes, and red dashed lines denote glandular structures. Mucin and necrotic debris are pointed with red and black arrows, respectively. (Scale bar, 50 μm.) Note that a fine line of agarose inclusion might be detected around the xenograft due to the agarose embedding step prior to paraffin inclusion. |
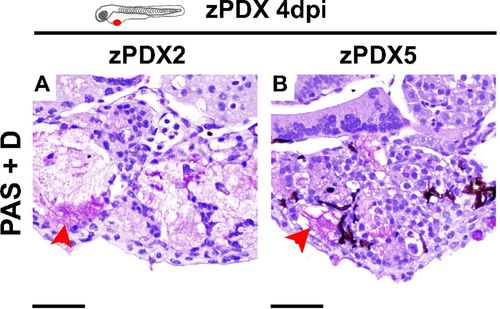
PAS+D staining of zPDX sections. Representative microphotographs zPDX tumors derived from patient#2 (A) and patient#5 (B) at 4 dpi; red arrows depict mucin content within glandular structures by PAS+D staining. (Scale bar, 50 μm.) Note that a fine line of agarose inclusion might be detected around the xenograft due to the agarose embedding step prior to paraffin inclusion. |
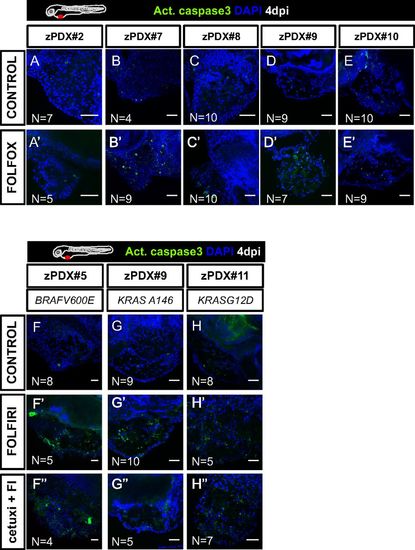
zPDX treatments. Five zPDX were treated with FOLFOX for 3 days and processed for activated caspase3 immunofluorescence (A–E′). Three zPDX were treated with FOLFIRI and FOLFIRI plus Cetuximab, activated caspase3 was detected by immunofluorescence (F–H′′). Number of zPDX analyzed for each condition is indicated in the figure. (Scale bar, 50 μm.) |