
Fig. S5
- ID
- ZDB-FIG-180227-6
- Publication
- Fior et al., 2017 - Single-cell functional and chemosensitive profiling of combinatorial colorectal therapy in zebrafish xenografts
- Other Figures
- All Figure Page
- Back to All Figure Page
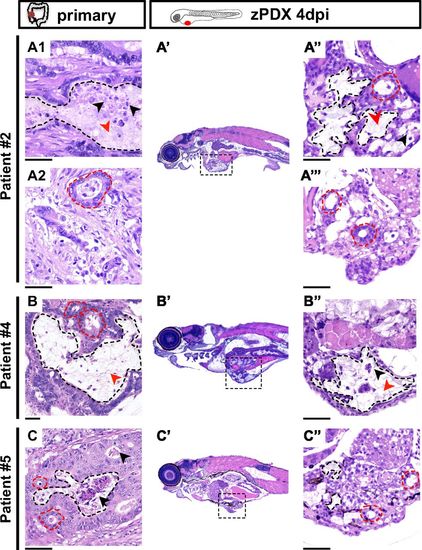
The zPDX conserve basic histological features of the original tumors. Representative microphotographs of parental tumors: patient #2 (A1 and A2), patient#4 (B), patient#5 (C), and their matching zebrafish PDX (A′–A′′′, B′ and B′′, and C′ and C′′). A′, B′, and C′ are a low magnification of a representative zPDX, showing localization of the tumor mass in the abdominal cavity. A′′, A′′′, B′′, and C′′ are higher magnifications of different tumors. Black dashed lines delineate mucin lakes, and red dashed lines denote glandular structures. Mucin and necrotic debris are pointed with red and black arrows, respectively. (Scale bar, 50 μm.) Note that a fine line of agarose inclusion might be detected around the xenograft due to the agarose embedding step prior to paraffin inclusion. |