
Fig. 1
- ID
- ZDB-FIG-180227-1
- Publication
- Fior et al., 2017 - Single-cell functional and chemosensitive profiling of combinatorial colorectal therapy in zebrafish xenografts
- Other Figures
- All Figure Page
- Back to All Figure Page
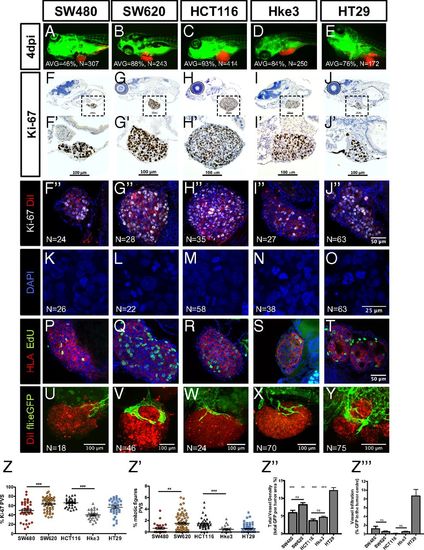
Implantation and histological analysis of human CRC zebrafish-xenografts. Human CRC cells (SW480; SW620; HCT116; Hke3 and HT29) were labeled with DiI dye (red) and injected into the PVS of 48-hpf zebrafish. At 4 dpi, the number of xenografts with a tumor implanted was quantified (A–E), and the average (AVG) implantation rate was determined from at least three independent experiments. Immunohistochemistry for Ki-67 in paraffin sections at 4-dpi xenografts (F–J′). Images were obtained using a Zeiss AxioScan Z1, generating tiled images. Note that a fine line of agarose inclusion might be detected around the xenograft due to the agarose embedding step prior to paraffin inclusion. Whole-mount immunofluorescence staining at 4 dpi, for Ki-67 (F′′–J′′). Representative images of mitotic figures in the corresponding xenografts (K–O), nuclei staining with DAPI in blue, anti-human HLA in red and EdU staining in green (P–T). Quantification of percentage of Ki-67 positive cells per xenograft (Z, ***P < 0.0001) and mitotic figures (Z′, ***P < 0.0001) in corresponding tumors (each dot represents one xenograft). Human CRC xenografts were generated in Tg(fli:eGFP) zebrafish to visualize blood vessels. Images representative of 4 dpi xenografts induced neovasculature: SW480 (U); SW620 (V); HCT116 (W); Hke3 (X) and HT29 xenografts (Y). Quantification of total vessel density (Z′′) and vessel infiltration (Z′′′); **/*** refers to comparison with HT29. HT29 tumors displayed significantly higher vessel density and infiltration than any other tumor, SW480 vs. HT29 (P = 0.0264); SW620 vs. HT29 (P = ns); HCT116 vs. HT29 (P < 0.0001); and Hke3 vs. HT29 (P < 0.0001). Infiltration potential SW480 vs. HCT116 (P = 0.0482); SW480 vs. HT29 (P = 0.0025); HCT116 vs. HT29 (P < 0.0001). Results in Z, Z′, Z′′, and Z′′′ are expressed as average (AVG) ± SEM. The number of xenografts analyzed for Ki-67; mitotic index and angiogenesis is indicated in the figures. All images in the same row are at the same magnification. *P < 0.05; **P < 0.005; ns, nonsignificant. |
| Gene: | |
|---|---|
| Fish: | |
| Condition: | |
| Anatomical Term: | |
| Stage: | Day 6 |