
Fig. 2
- ID
- ZDB-FIG-180227-2
- Publication
- Fior et al., 2017 - Single-cell functional and chemosensitive profiling of combinatorial colorectal therapy in zebrafish xenografts
- Other Figures
- All Figure Page
- Back to All Figure Page
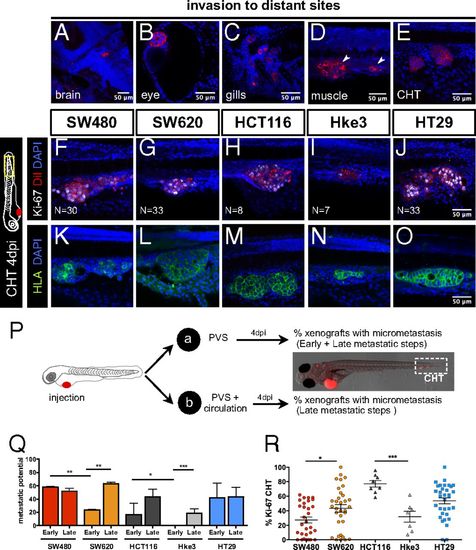
Human CRC cells show different metastatic potential. At 4 dpi, it is possible to detect human tumor cells throughout the zebrafish body, in the brain (A), eye (B), gills (C), muscle (D), and CHT (E). Immunofluorescence for Ki-67 (F–J) and anti-human HLA (K–O) in the CHT region at 4 dpi in the indicated xenografts. To distinguish between early and late metastatic steps, tumor cells were injected into the PVS only (group_a) or in the PVS and directly into circulation (group_b) (P). Quantification of Early (EMP) and Late (LMP) Metastatic Potential (Q) and percentage of Ki-67 positive cells in the CHT micrometastasis (R); each dot represents one xenograft. Results are averages from at least three independent experiments. The number of xenografts analyzed for Ki-67 is indicated in the images. The number of xenografts analyzed for EMP and LMP are as follows: SW480 (EMP, n = 62; LMP, n = 66); SW620 (EMP, n = 50; LMP, n = 69); HCT116 (EMP, n = 73; LMP, n = 57); Hke3 (EMP, n = 74; LMP, n = 250); HT29 (EMP, n = 31; LMP, n = 94) (Q). Results in Q and R are expressed as AVG ± SEM. Nuclei staining with DAPI is in blue. All pictures in the same row (F–O) are at the same magnification. All images are anterior to the left, posterior to right, dorsal up, and ventral down. *P < 0.05; **P < 0.005; ***P < 0.0001. |