
Image
|
Figure Caption
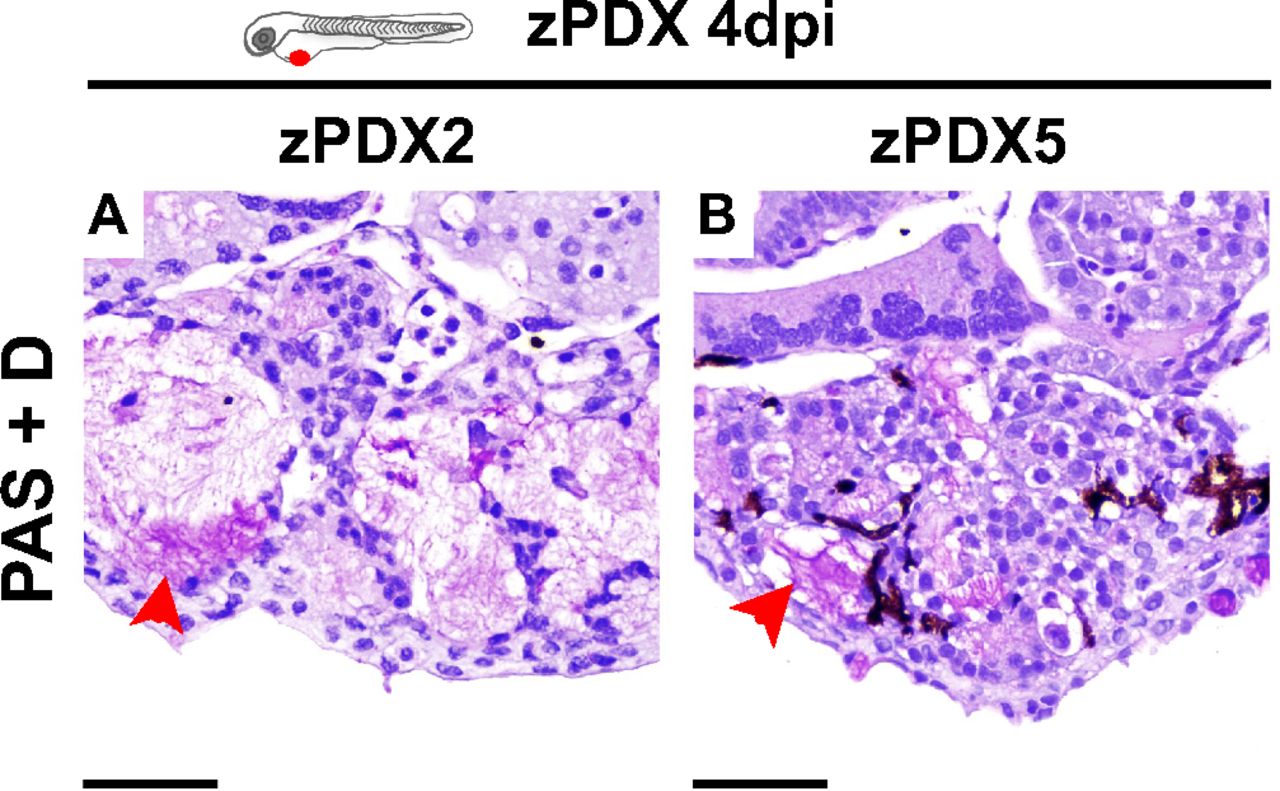
Fig. S6
PAS+D staining of zPDX sections. Representative microphotographs zPDX tumors derived from patient#2 (A) and patient#5 (B) at 4 dpi; red arrows depict mucin content within glandular structures by PAS+D staining. (Scale bar, 50 μm.) Note that a fine line of agarose inclusion might be detected around the xenograft due to the agarose embedding step prior to paraffin inclusion.
Acknowledgments
This image is the copyrighted work of the attributed author or publisher, and
ZFIN has permission only to display this image to its users.
Additional permissions should be obtained from the applicable author or publisher of the image.
Full text @ Proc. Natl. Acad. Sci. USA