
- Title
-
An Adenosine Receptor for Olfaction in Fish
- Authors
- Wakisaka, N., Miyasaka, N., Koide, T., Masuda, M., Hiraki-Kajiyama, T., Yoshihara, Y.
- Source
- Full text @ Curr. Biol.
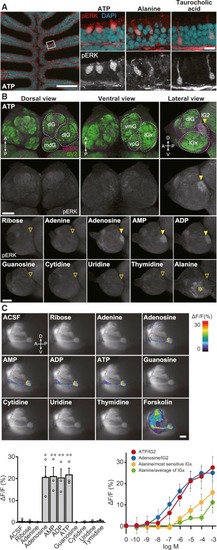
Figure 2. Primary Olfactory Pathway Activated by ATP and Related Molecules (A) ATP activates unique “pear-shaped” OSNs. pERK immunohistochemistry of zebrafish OE sections exposed to 10 μM ATP, 10 mM alanine, and 10 mM taurocholic acid (n = 3–5). The leftmost panel shows a low-magnification view of OE stimulated with ATP. Right panels are magnified views of OE stimulated with ATP (left), alanine (middle), and taurocholic acid (right). Red, pERK; cyan, DAPI. Scale bars, 100 μm (left), 50 μm (right). (B) pERK immunostaining of whole-mount OB. Top: whole-mount OB of 10 μM ATP-stimulated fish stained with anti-pERK (magenta) and anti-SV2 (green) antibodies. Bottom: lateral views of anti-pERK-labeled whole-mount OB of zebrafish exposed to various compounds. Adenine nucleotides and adenosine (10 μM) specifically activate lG2, whereas alanine (10 mM) activates multiple lateral glomeruli (asterisk), but not lG2. Closed arrowheads, pERK-positive lG2; open arrowheads, pERK-negative lG2. Abbreviations for glomerular clusters are as follows: dG, dorsal; dlG, dorsolateral; lG, lateral; mdG, mediodorsal; vmG, ventromedial; vpG, ventroposterior. Scale bar, 100 μm. (n = 3–6). (C) Ca2+ imaging of OB glomeruli in OMP:Gal4FF;UAS:G-CaMP7 transgenic zebrafish. Top: representative Ca2+ responses of lG2 upon stimulation with 10 μM ATP and related molecules. Scale bar, 50 μm. Bottom left graph: quantification of Ca2+ increase in lG2. Values represent mean ± SEM (n = 3). Unpaired t test (adenosine, p = 0.015; AMP, p = 0.0088; ADP, p = 0.0082; ATP, p = 0.0025; ∗p < 0.05, ∗∗p < 0.01). Bottom right graph: dose-response relationship of glomerular Ca2+ increase by ATP (red), adenosine (blue), and alanine (yellow, green). A response curve for the most sensitive lGx glomerulus to alanine is shown in yellow, while the averaged response of multiple lGx glomeruli to alanine is shown in green. EXPRESSION / LABELING:
|
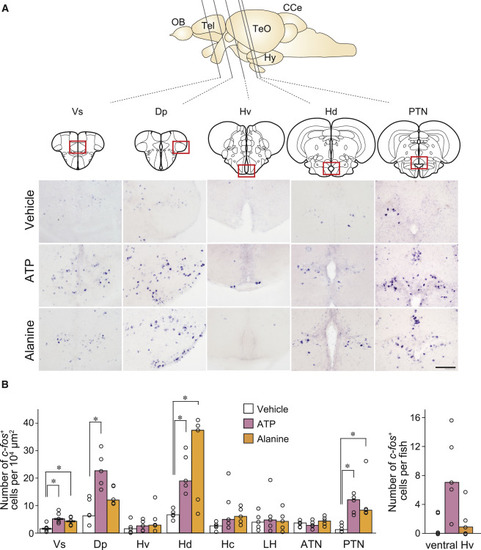
Higher Brain Centers Activated by ATP and Alanine (A) In situ hybridization with c-Fos cRNA probe on brain sections of zebrafish exposed to vehicle, ATP, and alanine. Vertical lines in the schematic zebrafish brain indicate the anterior-posterior positions of five coronal sections. Abbreviations for brain regions are as follows: Tel, telencephalon; TeO, optic tectum; Hy, hypothalamus; CCe, cerebellum. Red boxes indicate the locations of magnified views. Scale bar, 100 μm. (B) Quantification of c-Fos-positive neurons in nine brain regions. Abbreviations for brain regions are as follows: Vs, supracommissural nucleus of ventral telencephalic area; Dp, posterior zone of dorsal telencephalic area; Hv, ventral zone of periventricular hypothalamus; Hd, dorsal zone of periventricular hypothalamus; Hc, central zone of periventricular hypothalamus; LH, lateral hypothalamic nucleus; ATN, anterior tuberal nucleus; PTN, posterior tuberal nucleus. Values represent median (n = 5). Wilcoxon rank sum test with Bonferroni’s correction (Vs, p = 0.024; Dp, p = 0.024; Hd, p = 0.024; PTN, p = 0.024 for vehicle versus ATP; Vs, p = 0.024; Hd, p = 0.048; PTN, p = 0.024 for vehicle versus alanine). ∗p < 0.05. |

ATP Activates OSNs Expressing a Novel Adenosine Receptor A2c (A) Double fluorescence in situ hybridization for c-Fos (green) and ORs, V1Rs, V2RL1, or TAARs (magenta) on OE sections of 1 mM ATP-exposed fish (n = 3). No double-positive OSNs are observed. See also Table S1. (B) Double fluorescence in situ hybridization for c-Fos (green) and A2c (magenta) on OE sections of 1 mM ATP-exposed fish (n = 4). Note that all c-Fos-positive OSNs express A2c mRNA. Inset: a magnified view of the boxed region. (C) Double fluorescence in situ hybridization for A2c (magenta) and Golf or ACIII (green) on OE sections (n = 3). A2c-positive OSNs express Golf and ACIII mRNA. Insets: magnified views of the boxed regions. EXPRESSION / LABELING:
|
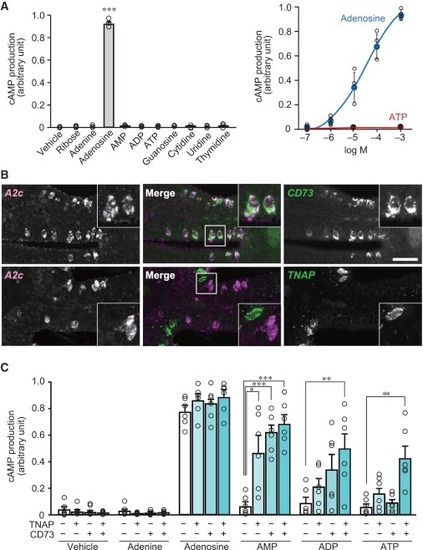
Conversion of ATP to Adenosine by Two Ecto-nucleotidases Expressed in the OE (A) Ligand specificity (left, n = 3) and sensitivity (right, n = 4) of A2c receptor examined by cAMP production assay in CHO-K1 cells. A2c is activated only by adenosine with high specificity and sensitivity. Unpaired t test (p = 0.00000016). ∗∗∗p < 0.001. (B) Double fluorescence in situ hybridization for A2c (magenta) and CD73 or TNAP (green) on OE sections (n = 3–4). Insets: magnified views of the boxed regions. Note the co-expression of A2c and CD73. Scale bar, 20 μm. (C) Expression of TNAP and CD73 together with A2c in CHO-K1 cells results in A2c activation by AMP, ADP, and ATP as well as adenosine (1 mM) (n = 6). Unpaired t test (AMP, TNAP/CD73 +/–, p = 0.014; –/+, p = 0.0000044; +/+, p = 0.0000067; ADP, +/+, p = 0.0088; ATP, +/+, p = 0.0032). EXPRESSION / LABELING:
|
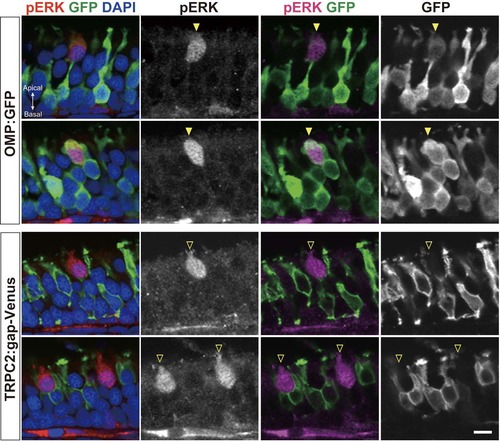
ATP activates a unique type of OSNs with pear-shaped morphology. Related to Figure 2. pERK immunohistochemistry of OE sections from OMP:GFP (top) and TRPC2:gap-Venus (bottom) transgenic zebrafish exposed to 10 μM ATP (n=2). ATP induces ERK phosphorylation specifically in pear-shaped OSNs that are OMP:GFP-positive, but TRPC2:gap-Venus-negative. Although these pear-shaped OSNs exhibits several hallmarks of ciliated OSNs (OMP:GFP, Golf, ACIII), they do not have a long dendrite and are located at the very apical layer of the OE. Scale bar, 5 μm. |
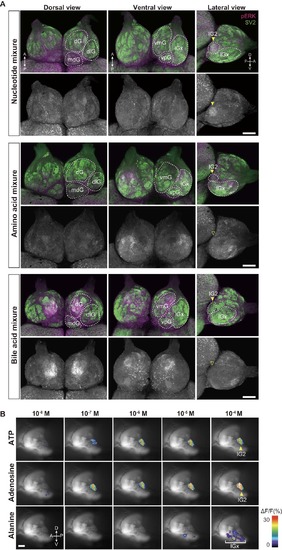
Activation of distinct glomeruli by nucleotides, amino acids and, bile acids. Related to Figure2. (A) pERK immunostaining of whole-mount OB. Zebrafish were exposed to nucleotide mixture (ATP, IMP, TTP, 10 mM each), amino acid mixture (alanine, cysteine, histidine, lysine, methionine, phenylalanine, tryptophan, valine, 10 mM each), and bile acid mixture (glycocholic acid, taurocholic acid, taurodeoxycholic acid, 10 mM each) and their brains were subjected to immunohistochemistry with anti-pERK antibody. Amino acid mixture activates multiple glomeruli in the lateral cluster (lGx), while bile acid mixture activates dorsal and ventromedial glomerular clusters (dG and vmG). lG2 (arrowheads) is activated by nucleotide mixture, but not by amino acid and bile acid mixtures. Scale bars, 100 μm. (B) Ca2+ imaging of OB glomeruli in OMP:Gal4FF;SAGFF27A;UAS:G-CaMP7 transgenic zebrafish. Representative images of Ca2+ responses in lG2 and lGx upon stimulation with ATP, adenosine and alanine, respectively. Scale bar, 50 μm |
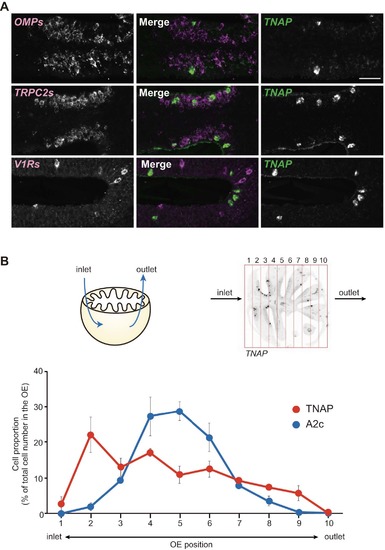
TNAP is expressed in non-neuronal cells predominantly located in the anterior OE close to the inlet naris. Related to Figure 6. |

CD73/TNAP inhibitors and A2c antagonist attenuate the activation of lG2, but not other glomeruli. Related to Figure 7. |