
|
Fig. 2
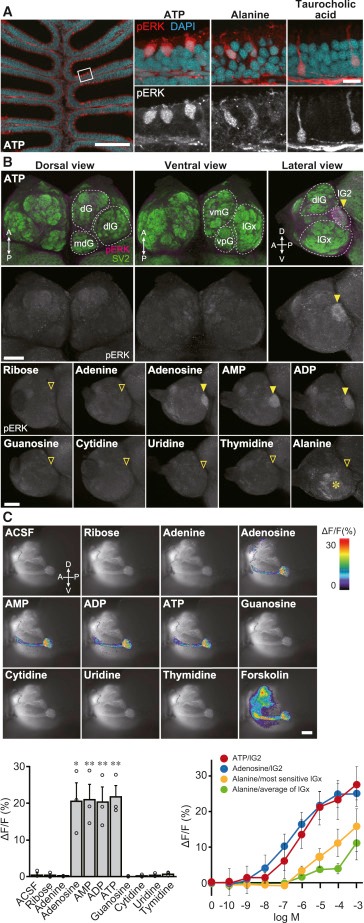
Figure 2. Primary Olfactory Pathway Activated by ATP and Related Molecules
(A) ATP activates unique “pear-shaped” OSNs. pERK immunohistochemistry of zebrafish OE sections exposed to 10 μM ATP, 10 mM alanine, and 10 mM taurocholic acid (n = 3–5). The leftmost panel shows a low-magnification view of OE stimulated with ATP. Right panels are magnified views of OE stimulated with ATP (left), alanine (middle), and taurocholic acid (right). Red, pERK; cyan, DAPI. Scale bars, 100 μm (left), 50 μm (right).
(B) pERK immunostaining of whole-mount OB. Top: whole-mount OB of 10 μM ATP-stimulated fish stained with anti-pERK (magenta) and anti-SV2 (green) antibodies. Bottom: lateral views of anti-pERK-labeled whole-mount OB of zebrafish exposed to various compounds. Adenine nucleotides and adenosine (10 μM) specifically activate lG2, whereas alanine (10 mM) activates multiple lateral glomeruli (asterisk), but not lG2. Closed arrowheads, pERK-positive lG2; open arrowheads, pERK-negative lG2. Abbreviations for glomerular clusters are as follows: dG, dorsal; dlG, dorsolateral; lG, lateral; mdG, mediodorsal; vmG, ventromedial; vpG, ventroposterior. Scale bar, 100 μm. (n = 3–6).
(C) Ca2+ imaging of OB glomeruli in OMP:Gal4FF;UAS:G-CaMP7 transgenic zebrafish. Top: representative Ca2+ responses of lG2 upon stimulation with 10 μM ATP and related molecules. Scale bar, 50 μm. Bottom left graph: quantification of Ca2+ increase in lG2. Values represent mean ± SEM (n = 3). Unpaired t test (adenosine, p = 0.015; AMP, p = 0.0088; ADP, p = 0.0082; ATP, p = 0.0025; ∗p < 0.05, ∗∗p < 0.01). Bottom right graph: dose-response relationship of glomerular Ca2+ increase by ATP (red), adenosine (blue), and alanine (yellow, green). A response curve for the most sensitive lGx glomerulus to alanine is shown in yellow, while the averaged response of multiple lGx glomeruli to alanine is shown in green.