
|
Fig. S6
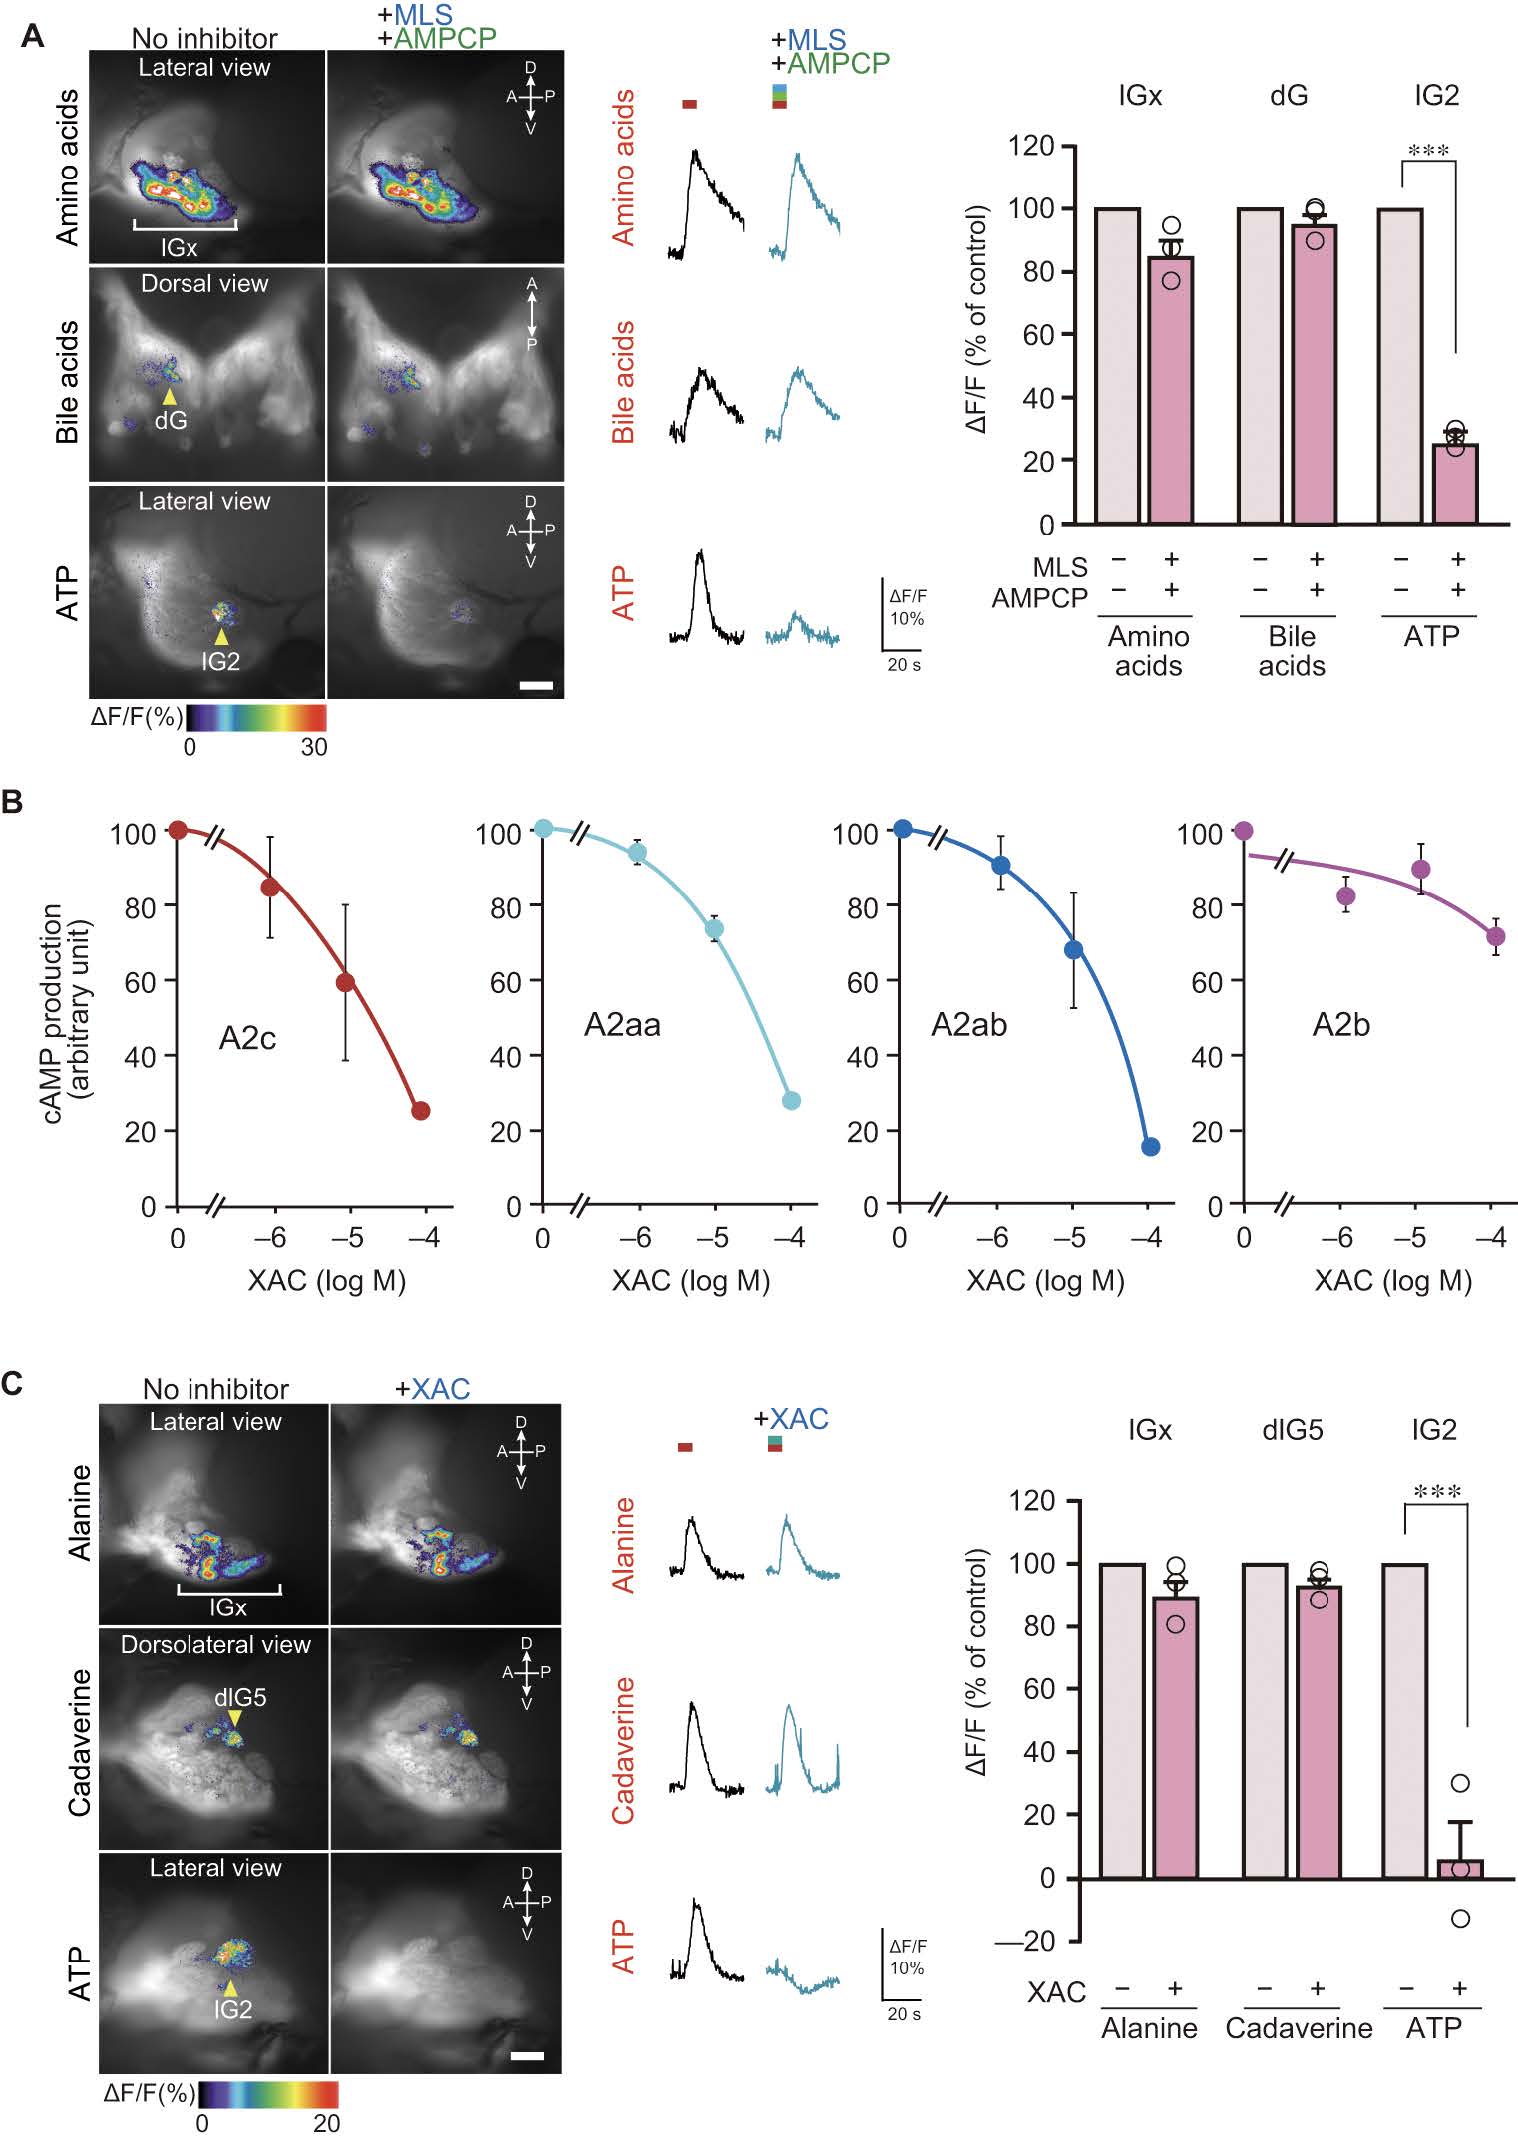
CD73/TNAP inhibitors and A2c antagonist attenuate the activation of lG2, but not other glomeruli. Related to Figure 7.
(A) Effects of TNAP and CD73 inhibitors (MLS0038949 and AMPCP) on glomerular activation by amino acid mixture, bile acid mixture and ATP in OMP:Gal4FF;SAGFF27A;UAS:G-CaMP7 transgenic zebrafish. Left panels, representative Ca2+ responses of the glomeruli (images and traces) upon stimulation with amino acid mixture (alanine, cysteine, histidine, lysine, methionine, phenylalanine, tryptophan, valine; 10 μM each) (top row), bile acid mixture (glycocholic acid, taurocholic acid, taurodeoxycholic acid; 10 & mu;M each) (middle row) and 1 μM ATP (bottom low) in the presence or absence of 0.5 mM MLS0038949 and 0.25 mM AMPCP. Amino acid mixture, bile acid mixture and ATP activate lGx, dG and lG2, respectively. Scale bar, 50 μm. Right graph, quantification of Ca2+ increase in the glomeruli. Values represent mean ± s.e.m. (n=3). Values for ATP are the same data from Figure 7A. Unpaired t-test (ATP, p=0.00000081). ***p < 0.001.
(B) Effects of XAC on 10 μM adenosine in A2c-, A2aa-, A2ab-, and A2b-expressing CHO-K1 cells. Antagonistic actions of XAC are observed for zebrafish A2c, A2aa and A2ab, but not A2b. IC50 values of XAC for A2c, A2aa, A2ab are 25.9 μM, 48.5 μM and 20.2 μM, respectively.
(C) Effect of A2c antagonist XAC on glomeruli activation by alanine, cadaverine and ATP in OMP:Gal4FF;SAGFF27A;UAS:G-CaMP7 transgenic zebrafish. Left panels, representative Ca2+ responses of the glomeruli (images and traces) upon stimulation with 10 μM alanine (top row), 10 μM cadaverine (middle row) and 1 μM ATP (bottom low) in the presence or absence of 10 μM XAC. Alanine, cadaverine and ATP activate lGx, dlG5 and lG2, respectively. Scale bar, 50 μm. Right graph, quantification of Ca2+ increase in the glomeruli. Values represent mean ± s.e.m. (n=3). Values for ATP, alanine and cadaverine are the same data from Figure 7C. Unpaired t-test (ATP, p=0.0016). ***p < 0.001.