
Fig. 6
- ID
- ZDB-FIG-180221-31
- Publication
- Wakisaka et al., 2017 - An Adenosine Receptor for Olfaction in Fish
- Other Figures
- All Figure Page
- Back to All Figure Page
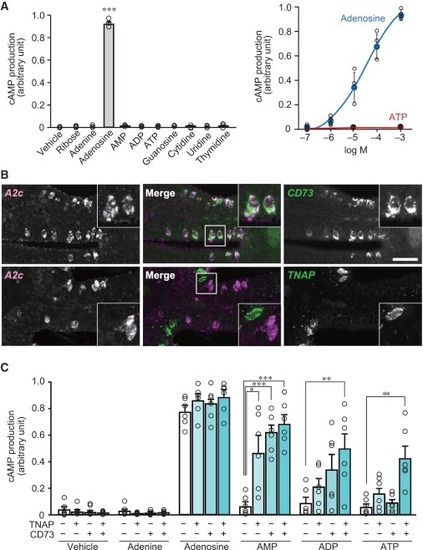
Conversion of ATP to Adenosine by Two Ecto-nucleotidases Expressed in the OE (A) Ligand specificity (left, n = 3) and sensitivity (right, n = 4) of A2c receptor examined by cAMP production assay in CHO-K1 cells. A2c is activated only by adenosine with high specificity and sensitivity. Unpaired t test (p = 0.00000016). ∗∗∗p < 0.001. (B) Double fluorescence in situ hybridization for A2c (magenta) and CD73 or TNAP (green) on OE sections (n = 3–4). Insets: magnified views of the boxed regions. Note the co-expression of A2c and CD73. Scale bar, 20 μm. (C) Expression of TNAP and CD73 together with A2c in CHO-K1 cells results in A2c activation by AMP, ADP, and ATP as well as adenosine (1 mM) (n = 6). Unpaired t test (AMP, TNAP/CD73 +/–, p = 0.014; –/+, p = 0.0000044; +/+, p = 0.0000067; ADP, +/+, p = 0.0088; ATP, +/+, p = 0.0032). |
| Genes: | |
|---|---|
| Fish: | |
| Condition: | |
| Anatomical Terms: | |
| Stage: | Adult |