
- Title
-
Fine-tune regulation of carboxypeptidase N1 controls vascular patterning during zebrafish development
- Authors
- Wu, T.Y., Wang, Y.S., Song, Y.C., Chen, Z.Y., Chen, Y.T., Chiu, C.C., Wu, C.Y.
- Source
- Full text @ Sci. Rep.
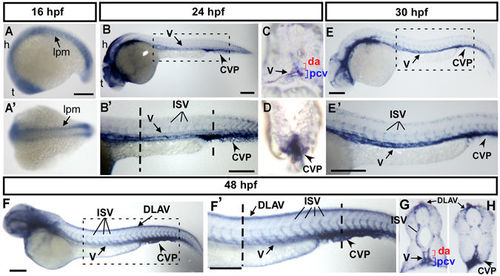
Spatiotemporal expression of cpn1 during zebrafish development. (A) The lateral view shows cpn1 mRNA expression at the 18 S stage in the lateral plate mesoderm (l pm), hindbrain (h), and telencephalon (t). (A′) The dorsal view of the embryos shows cpn1 expression in the lpm. (B,B′) At 24 hpf, cpn1 was expressed in the vessels (v), intersegmental vessels (ISV) and caudal vein plexus (CVP) of the trunk. B′ is an enlargement of B. (C,D) The cross sections of embryos from B′ demonstrate that cpn1 is expressed in the dorsal aorta (da), posterior cardinal vein (pcv) and CVP. (E,E′) At 30 hpf, cpn1 was expressed in the vessels (v), ISV, and CVP of the trunk. E′ is an enlargement of E. (F,F′,G,H) At 48 hpf, cpn1 was expressed in ISVs, dorsal longitudinal anastomotic vessels (DLAV), vessels (v), da, pcv and CVP, as observed in the lateral view and transverse sections of the embryo trunk and tail regions. F′ is an enlargement of F. Scale bars in all figures represent 200 µm. EXPRESSION / LABELING:
|
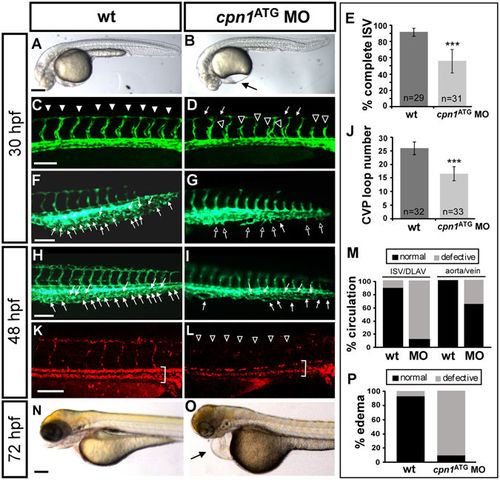
Knockdown of cpn1 causes vascular defects in zebrafish development. (A,B) The bright field images of control and cpn1 ATG morpholino (3.41 ng)-injected embryos at 30 hpf. (C–J) At 30 hpf, ISVs reached DLAV and formed a honeycomb-like structure in the caudal vein plexus (CVP) in wild-type controls by using Tg (fli1:eGFP y1) zebrafish (C,F). Compared with wild-type control (arrowheads in C, arrows in F), loss of cpn1 caused ISV growth defects (hollow arrowheads in D) and less honeycomb-like structure formation in CVP (arrows in G). At 48 hpf, less CVP loop formation (arrows in I) compared with that in control (arrows in H). (K,L) The injection of cpn1 ATG MO into Tg (fli1a:eGFP y1; gata1:dsRed sd2) embryos revealed that loss of cpn1 caused circulation defects in ISVs at 48 hpf. (N,O) At 72 hpf, cpn1 ATG morphants had pericardial edema (arrow in O). (E) The percentage of completed ISVs decreased by approximately 45% in cpn1 ATG morphants (n = 29 in wt and n = 31 in cpn1 ATG MO) at 30 hpf. (J) The loop formation in CVP exhibited a decrease in cpn1 ATG morphants (n = 32 in wt and n = 33 in cpn1 ATG MO) at 48 hpf. (M) Quantification data showed cpn1 morphants had approximately 90% defects in the ISV–DLAV circulation and 40% defects in the aorta–vein circulation compared to controls (n = 39 in control and n = 28 in cpn1 MO) at 48 hpf. (P) The percentage of pericardial edema was 90% in cpn1 ATG morphants compared with that in controls (n = 127 in controls and n = 50 in cpn1 ATG MO) at 72 hpf. These results were confirmed by three independent experiments. Data are represented as means ± S.D. ***Refers to p < 0.0001 by an unpaired Student’s t-test. The scale bar is 200 µm for A, B, N, and O, and 100 µm for C–L. PHENOTYPE:
|
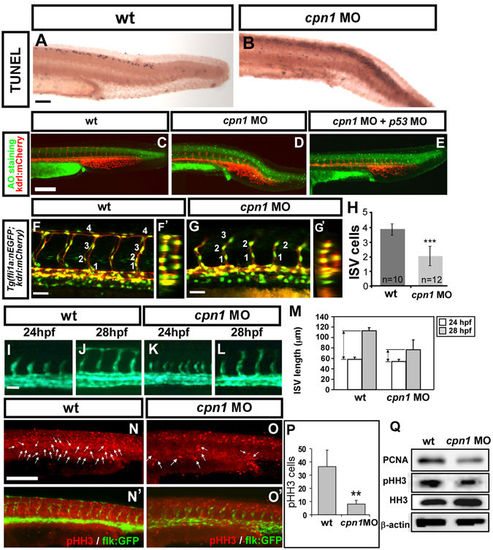
Knockdown of cpn1 impairs the growth of ISV cells. (A–E) TUNEL assay and acridine orange (AO) staining was used to detect apoptotic cells in wt and cpn1 morphants. (A,B) Apoptotic cells (black dots) were observed in the dorsal region, but not in the vasculature in cpn1 morphants. (C–E) Representative images of AO staining in uninjected control (C), cpn1 morphants (D) and cpn1 MO co-injected with p53 MO (E) on Tg(kdrl:mCherry)ci5 fish. Some increased apoptotic cells were observed on the skin and at the epidermis of the tail region in cpn1 MO (D), but not in the vasculature as compared to controls (C). Co-injection of cpn1 MO with p53 MO showed a reduction of apoptotic cells but still caused vascular defects in ISV and CVP (E). (F,F′,G,G′) Lateral and cross-sectional views of confocal images of Tg(kdrl:mCherry ci5; fli1a:nEGFP y7) embryos with cpn1 MO injection (G,G′) and uninjected control (F,F′) at 30hpf. (H) Quantification of the average number of cells per ISV in wt (n = 10) and cpn1 MO (n = 12) at 30 hpf. (I–L) Migration assay is used to measure the difference of ISV length from 24 hpf to 28 hpf in wt control and cpn1 MO (n = 6 in wt and morphants), and quantitative results are shown in M. (N,N′,O,O′) Proliferation marker pHH3 from immunofluorescent image was counted in the trunk region beneath the neural tube and above yolk extension area, which is related to the regions of the main vessels and ISVs. (P) The number of mitotic cells (pHH3 cells) in control was 36.4 ± 12.4 (n = 8) and in cpn1 MO was 8 ± 2.9 (n = 6). (Q) Western blot analysis showed a reduced expression level of phosphor-histone H3 (pHH3) and another proliferation marker PCNA. β-actin and histone H3 serve as loading controls. Scale bars are 200 μm for (A–E,N,O, N′,O′) and 50 μm for (F,G,I–L). All results were performed by two independent experiments and data are represented as means ± S.D. ***Refers to p < 0.0001 and **refers to p < 0.001 by an unpaired Student’s t-test. |
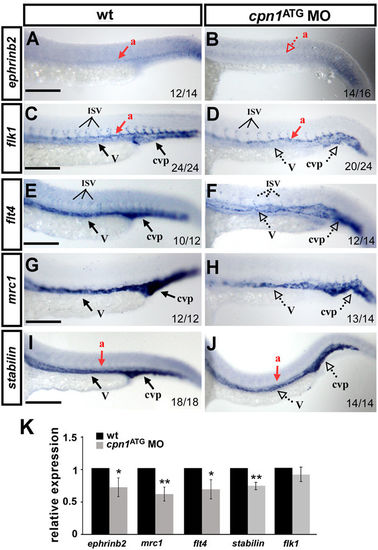
Knockdown of cpn1 modulates the expression of vascular markers. Compared with wild-type (wt) controls (A,C,E,G,I), cpn1 ATG morphants had decreased expression of the arterial marker ephrinb2 (B), venous markers mrc1 (H) and flt4 (F), and pan-vascular markers flk (D) and stabilin (J). dorsal aorta (a); vein (v); intersegmental vessels (ISV) and caudal vein plexus (cvp). The values on the bottom indicate the number of embryos exhibiting phenotype per total number of embryos analyzed from two independent experiments. (K) qPCR assay showed the relative expression level of ephrinb2 (0.71 ± 0.12), mrc1(0.61 ± 0.11), flt4 (0.69 ± 0.15), satbilin (0.74 ± 0.06) and flk1(0.9 ± 0.11) in cpn1 ATG morphants and in wt controls. qPCR data are represented as means ± S.D. **Refers to p < 0.01 and *refers to p < 0.05 according to the unpaired Student’s t-test. Scale bars are 200 µm. |
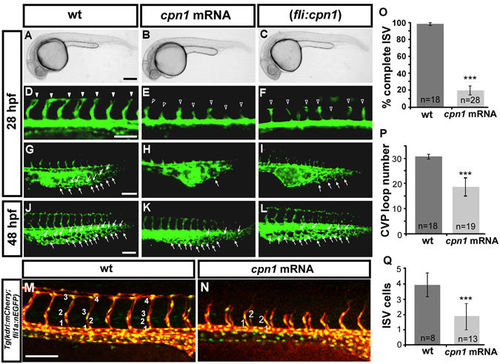
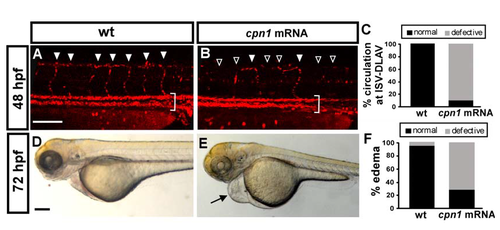
Overexpression of cpn1 causes vascular defects in zebrafish embryos. (A–C) The bright field images of uninjected control and cpn1 mRNA-injected (0.93ng) and (fli1:cpn1) embryos at 28 hpf. Compared with controls (arrowheads in (D), arrows in (G), the overexpression of cpn1 caused ISV growth defects (hollow arrowheads in (E, F) and less honeycomb-like structure formation in CVP at 28 hpf (H,I). At 28 hpf, ISVs reached DLAV and formed a honeycomb-like structure in CVP in controls. At 48 hpf, CVP loop formation was less (arrows in K, L) than in controls (arrows in J). (M,N) Injection of cpn1 mRNA into Tg(kdrl:mCherry ci5; fli1a:nEGFP y7) embryos (N) shows that the cell number per ISV was lower than in control (M) and ISVs did not reach DLAV as compared to control at 28hpf. (O) The percentage of completed ISVs decreased by approximately 80% in cpn1 mRNA injected embryos (n = 18 in wt and n = 28 in cpn1 mRNA) at 28 hpf. (P) The loop formation at CVP decreased in cpn1 mRNA injected samples (n = 18 in wt and n = 19 in cpn1 mRNA) at 48 hpf. (Q) The average number of cells per ISV decreased in cpn1 mRNA injected embryos (n = 8 in wt and n = 15 in cpn1 mRNA) at 30 hpf. The images are the representative pictures from two independent experiments. Quantitative data are represented as means ± S.D. ***Refers to p < 0.0001 by an unpaired Student’s t-test. Scale bars are 200 µm for A–C and 100 µm for D–N. |
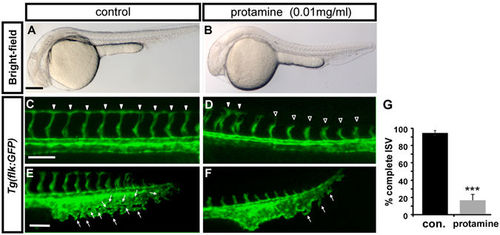
Inhibition of carboxypeptidase activity causes vascular defects. (A,B) Bright-field images of untreated control and embryos treated with 0.01 mg/ml protamine, a carboxypeptidase inhibitor. (C–F) The protamine-treated embryos showed stalling of ISVs (D) and mispatterned CVP (F) compared with completed growth of ISV (arrowheads in C) and the sprouting or loop structure of CVP (E) in wild-type embryos at 30 hpf. (E) The quantification of complete ISVs in embryos treated with 0.01 mg/ml protamine (18 ± 7%, n = 10) and untreated controls (92 ± 3%, n = 10). The data shown is representative of two independent experiments. Data are represented as means ± S.D. ***Refers to p < 0.0001 by an unpaired Student’s t-test. Scale bars are 200 µm for A-B and 100 µm for C-F. PHENOTYPE:
|
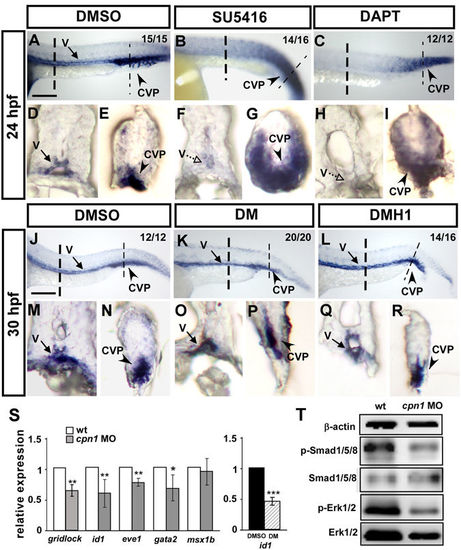
Interaction among cpn1, VEGF/Notch, and BMP signals. In the trunk region, the expression level of cpn1 was decreased in SU5416- (B,F) and DAPT (C,H)-treated embryos. In the tail region, the ectopic expression of cpn1 was observed in SU5416- (B,G) or DAPT-treated (C,I) embryos compared with that in DMSO-control embryos (A,D,E). (D–I) Transverse sections of the embryo trunk and tail region from A, B, and C. (J–R) Using DM and DMH1 to specify inactive BMP signals. In the trunk region, the expression level of cpn1 remained unchanged after DM (K,O) or DMH1 (L,R) treatment compared with that in DMSO control (J,M). In the tail region, the expression of cpn1 exhibited no differences in either DM (K,P) or DMH1 (L,R) treatment compared with that in DMSO controls (J,N). (M–R) Transverse sections of the embryo trunk and tail regions from J-L. Values on the top right indicate the number of embryos exhibiting phenotype per total number of embryos analyzed from 2 indepenedent experiments. Scale bars in A-C, J-L are 200 µm. (S) Relative expression of Notch downstream target gridlock and BMP regulated targets id1, eve1, gata2 and msx1b. The expression of id1 is downregulated while the BMP signal is blocked by DM treatment compared to DMSO as a positive control. Data are represented as means ± S.D. ***Refers to p < 0.001, **refers to p < 0.01 and *refers to p < 0.05 by an unpaired Student’s t-test. (T) Western blot analysis from two independent experiments showed reduced phosphorylation of Smad1/5/8 and ERK1/2 in cpn1 morphants compared to control, and β-actin serves as a loading control. |
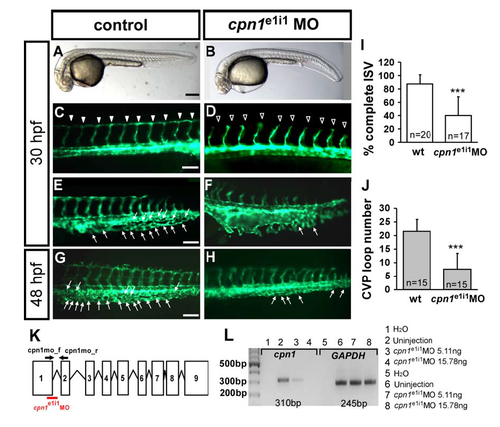
Specificity of cpn1 knockdown by splicing morpholino. (A–H) The knockdown of cpn1 by splicing MO caused similar defects in the vasculature, including defects in ISV growth (hallow arrowheads in D) and less CVP sprouting (F) and loop formation (H) (arrows) compared to wild-type control. (I) The percentage of completed ISVs decreased by about 47% in cpn1e1i1 morphants (n = 20 in wt and n = 17 in cpn1e1i1 MO) at 30 hpf. (J) The loop formation in CVP exhibited a decrease number 7.6 ± 5.8 in cpn1e1i1 morphants compared to wt control (21.6 ± 4.4) (n = 15 in wt and cpn1e1i1 MO) at 48 hpf. (K) The scheme presents cpn1e1i1 morpholino targeting the pre-mRNA structure of cpn1, suggesting the missplicing of a fragment, which can be detected using a cpn1mo_f and cpn1mo_r primer set. (L) Total RNA from controls or cpn1 morphants (injected with 5.11 ng or 15.78 ng cpn1e1i1 morpholino) was used in RT-PCR with primers for the cpn1 gene. In morphants injected with cpn1e1i1 morpholino, GAPDH levels remain unchanged, whereas the amount of cpn1 product (310 bp) decreased with an increase in the cpn1e1i1 morpholino dose. The data suggest that cpn1e1i1 morpholino-knockdown specifically targets cpn1. |
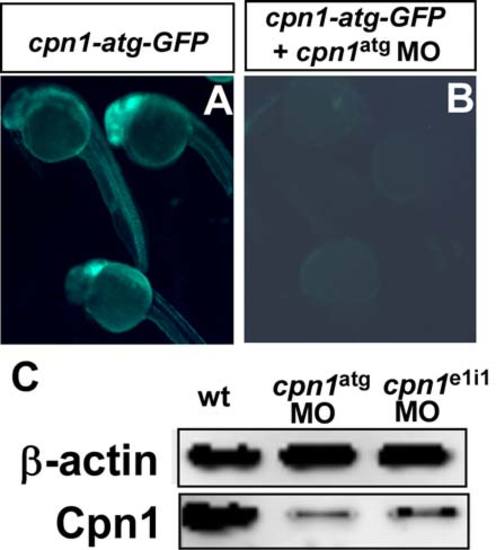
Targeting specificity of cpn1 ATG morpholinos. (A) At 24hpf, embryos injected with mRNA from the cpn1-atg-GFP construct results in GFP expression (n=24/25 with GFP). (B) Co-injection of (cpn1-atg-GFP) mRNA and cpn1 MO reduced and/or blocked the green signal in the embryos (n=2/22 with GFP). The images are the representative pictures from two independent experiments. (C) Western blot analysis showed the reduction of Cpn1 protein levels significantly by morpholino knockdown of cpn1 to block translation or to interfere with cpn1 splicing. Rabbit polyclonal anti-Cpn1 antibody (TA340008) is purchased from OriGene and β-actin serves as a loading control. The data shown is representative of two independent experiments. |
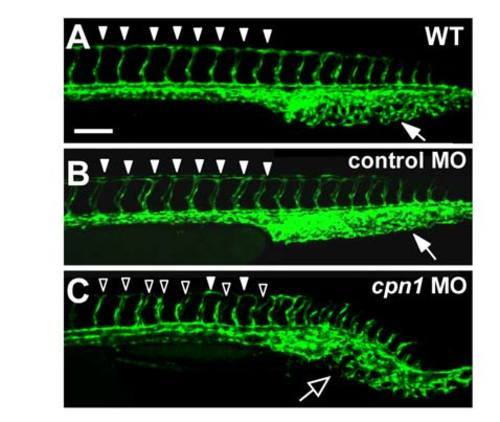
Injection of control morpholino does not cause vascular defects. (A-C) Confocal images analysis shows vascular development in ISV and CVP at 30 hpf in wild type uninjected control (A), standard negative control morpholino injected embryos (B) and injected with cpn1 translation blocking morpholinos (C). ISV and CVP was unaffected by control morpholino injection (arrow and arrowheads). Cpn1 morphants show a short or incompletion of ISVs (hollow arrowheads) and lack of CVP loops (arrow). The scale bar for A-C represent 100 μm. |
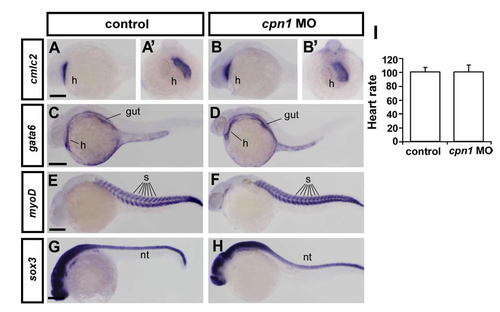
Gross developmental process is unaffected in cpn1 morphants. Knockdown of cpn1 did not alter the expression pattern of heart, gut, somite and neural systems by examining the expression of cmlc2 (heart marker, h; A-B are lateral view and A'-B' are ventral view), gata6 (heart and gut marker, C, D), myoD (somite marker, s, E, F), and sox3 (neural tube marker, nt, G, H). Those probes have been described and documented in ZFIN. (I) Knockdown of cpn1 did not cause developmental delay by measuring heart rate. Quantification of zebrafish heart beats per minute in uninjected control and cpn1 morphants shows no difference (n=16 in control and n=19 in cpn1 MO) at 24-25hpf. The mean heart rate determined by direct visual examination of ventricle beating in control was 100.7 ± 6.2 beats per minute, 100.4 ± 10.3 beats per minute in cpn1 MO. The scale bars represent 250 μm in A-H. |
Overexpression of cpn1 causes circulation defects and pericardial edema. (A-C) Injection of cpn1 mRNA into Tg(fli:eGFPy1 ; gata1:dsRed) embryos causes circulation defect at ISV-DLAV at 48hpf. Quantification data showed overexpressing cpn1 embryos with 90% defects in circulation compared to control (n=10 for both conditions). (D-F) At 72hpf, overexpresion of cpn1 shows pericardial edema (arrow in E). Quantification of percentage of pericardial edema showed ~70 % increase in cpn1 mRNA injected embryos compared to control (n=33 in control and n=28 in cpn1 mRNA injection) at 72hpf. Scale bars are 100 μm for A, B and 200 μm for D, E. |
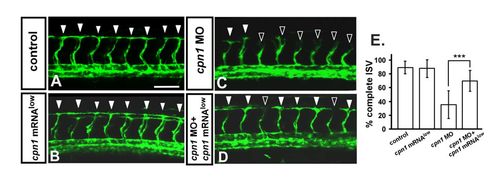
Knockdown of cpn1 can be rescued by overexpression of cpn1. In uninjected control embryos, ISV has reached the dorsal region and formed DLAV around 28– 30 hpf ((A), arrowheads). At the same stage in cpn1 MO, ISVs have stalled or slowed growth at mid-somite ((C), hollow arrowheads). Overexpression of cpn1 by cpn1mRNA (100pg) injection had no obvious defect in vasculature (B), but rescued the defect of ISV stalling ((D), solid arrowheads). (E) Quantification of percentage of completed ISV at 30 hpf shows a ~35% increase in rescued embryos compare to cpn1 morphants. Percentages of completed ISV are ~90 ± 9, 88 ± 13, 35 ± 20, and 70 ± 15 in control, cpn1 mRNA overexpression, cpn1 MO, and rescued embryos, respectively. (*** refers to p < 0.0001 by an unpaired Student's t-test. Data represent means ± S.D). Scale bars are 100 μm for (A–D). |
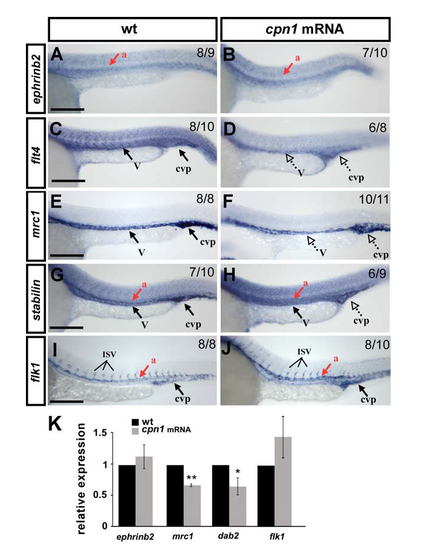
Overexpression of cpn1 alters the expression of vascular markers. The expression of vascular markers was examined by in-situ hybridization (A-J) and/or quantitative real-time PCR (K). Compared to the wild type controls at 24 hpf (A, C, E, G, I), the expression of the venous/ISV markers flt4 (D, K), mrc1 (F, K) and dab2 (K) was decreased in overexpressed cpn1 embryos (cpn1mRNA); the expression of the pan-vascular markers stabilin (H), and flk (J, K) was no-to-slightly increased in embryo; the expression of the arterial marker ephrinb2 is unchanged (B, K). (K) Quantitative results by qPCR showed the expression of vascular markers ephrinb2 (1.1 ± 0.2), mrc1 (0.64 ± 0.05), dab2 (0.62 ± 0.12) and flk1 (1.4 ± 0.3),) in overexpressing cpn1 embryos. Values on the top right indicate the number of embryos exhibiting phenotype per total number of embryos analyzed. Scale bars are 200 μm. dorsal aorta (a); vein (v), and caudal vein plexus (cvp). Data are represented as means ± S.D. ** refers to p < 0.001 and * refers to p < 0.05 by an unpaired Student's t-test. |