
- Title
-
Progranulin regulates neurogenesis in the developing vertebrate retina
- Authors
- Walsh, C.E., Hitchcock, P.F.
- Source
- Full text @ Dev. Neurobiol.
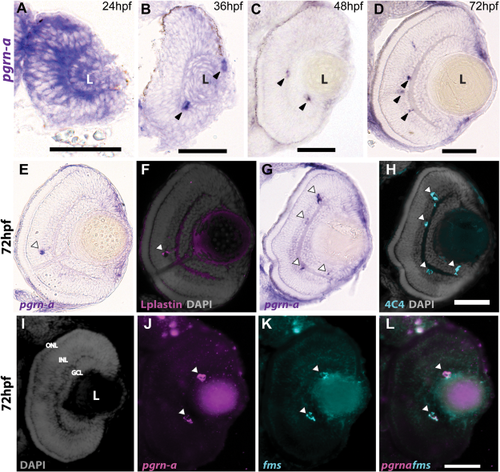
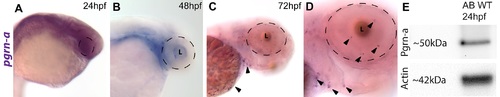
Expression of pgrn-a in the developing retina. (A–D) Cross-sections of the retina following whole mount in situ hybridizations (ISHs) showing pgrn-a expression in WT at 24 (A), 36 (B), 48 (C), and 72 hpf (D). (E–L) pgrn-a is microglia-specific by 72 hpf. pgrn-a ISH (E + G) followed by immunohistochemistry of L-plastin (F) and 4C4 (H) showing colocalization of pgrn-a and microglial markers (arrowheads). Double ISH in the same section showing DAPI (I), pgrn-a (J), and fms (K) expression, and overlay (L) showing colocalization of pgrn-a and fms in the retina (arrowheads). In panel D, it appears there is transcript expression in the CMZ. However, there is no evidence for this following whole mount ISH (see Supporting Information Fig. S1), and we infer that in sections this apparent labeling is spurious. Outer nuclear layer (ONL); inner nuclear layer (INL); and ganglion cell layer (GCL); (L) lens. Scale bar equals 50 µm. |
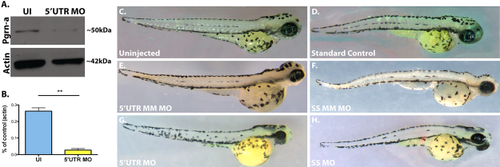
pgrn-a-targeted morpholino oligonucleotides inhibit Pgrn-a translation, which results in microphthalmia. (A) Western blot showing Pgrn-a and Actin expression in 72 hpf uninjected (UI) and morphant (5′UTR MO) embryos. (B) Histogram showing quantification of Pgrn-a expression in UI controls (26.2 ± 2.05%) and morphants (2.7 ± 0.9%); **p ≤ 0.01. Quantitative data from three biological and technical replicates is normalized to Actin and represented as mean; error bars represent the standard deviation. (C–H) Representative whole embryos from control (C–F) and experimental (G–H) groups at 72 hpf. 5′UTR MM MO and SS MM MO, embryos injected with 5-nucleotide mismatch control morpholinos; 5′UTR MO, embryos injected with pgrn-a 5′UTR-targeted morpholinos; SS MO, embryos injected with pgrn-a e3i3 splice site-targeted morpholinos. |
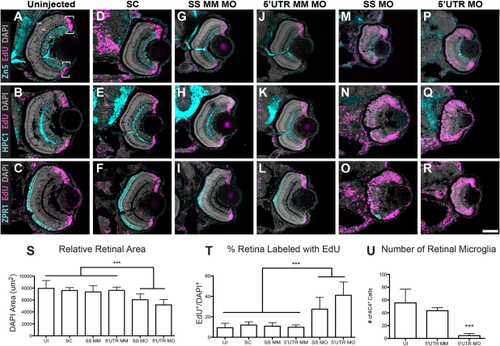
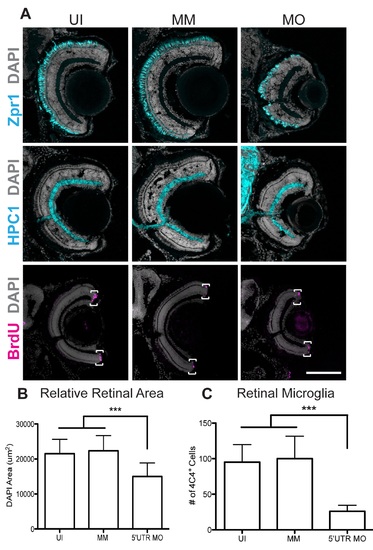
Pgrn-a knockdown results in microphthalmia and diminished neuronal differentiation. (A–R) Sections through central retina of uninjected (UI, A–C); standard control morpholino-injected (SC, D–F); SS MM (G–I) and 5′UTR MM (J–L), embryos injected with 5-nucleotide mismatch control morpholinos; SS MO (M–O) and 5′UTR MO (P–R), embryos injected with e3i3 splice site-targeted or 5′UTR-targeted morpholinos, respectively, at 72 hpf. Sections are immunolabeled (cyan) with markers of differentiated ganglion cells (Zn5, top row), amacrine cells (HPC1, middle row), and red–green double cone photoreceptor cells (ZPR1, bottom row), EdU (fusia), and DAPI (gray). (S) Histogram showing relative retinal area in UI (7945.8 ± 1319.6 μm2; n = 11; CI, 7945 ± 886), SC-injected (7594.3 ± 475.2 μm2; n = 9; 95% CI: 7594 (7229–7959)), SS MM MO-injected (7354 ± 1062.6 μm2; n = 11; 95% CI: 7353 (6640-8066)), and 5′UTR MM MO-injected (7610.8 ± 547.6 μm2; n = 10; 95% CI: 7610 (7219–8001)), SS MO (6044.7 ± 956.2 μm2; n = 10; 95% CI: 6044 (5360–6782)), and 5′UTR MO (5188.7 ± 891.8 μm2; n = 16; 95% CI: 5188 (4713–5663)) retinas at 72 hpf; ***p≤0.001. (T) Histogram showing the percent of the retina labeled with EdU in UI (9.3 ± 4.3%; n = 11; 95% CI: 9.3 (6.4–12.2)), SC-injected (12 ± 3.1%; n = 9; 95% CI: 12.0 (8.7–15.3)), SS MM MO-injected (10.8 ± 3.5%; n = 11; 95% CI: 10.8 (8.7–12.9)), 5′UTR MM MO-injected (9.8 ± 2.3%; n = 10; 95% CI: 9.8 (7.3–12.3)), SS MO-injected (27.5 ± 11.5%; n = 10; 95% CI: 27.6 (25.9–29.3)), and 5′UTR MO-injected (41.1 ± 13%; n = 16; 95% CI: 41.1 (35–47.2)) retinas at 72 hpf; ***p≤0.001. (U) Histogram showing the number of microglia in uninjected (UI; 55.4 ± 21.5 cells; n = 20; 95% CI: 62.4 (51.7–73.1)), 5′UTR mismatch morpholino injected (5′UTR MM; 43.4 ± 4.6 cells; n = 8; 95% CI: 43.4 (39.6–47.2)), and Pgrn-a morphant (5′UTR MO; 4.4 ± 3.4 cells; n = 11; 95% CI: 4.4 (2.1–6.7)) retinas at 72 hpf; ***p≤0.001. Quantitative data are represented as mean; error bars represent the standard deviation. Outer nuclear layer (ONL), inner nuclear layer (INL), and ganglion cell layer (GCL); ciliary marginal zone (CMZ, brackets). Scale bar equals 50 µm. |
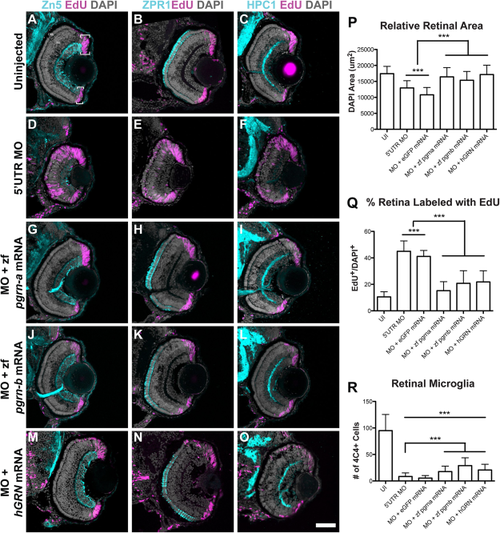
Coinjection of 5′UTR MO and zf pgrn-a, zf pgrn-b, or hGRN mRNA rescues most aspects of knockdown retinal phenotype. (A–O) Cross-sections through central retina of 72 hpf uninjected (UI, A–C), 5′UTR MO-injected (D–F), 5′UTR MO and zf pgrn-a mRNA coinjected (G–I), 5′UTR MO and zf pgrn-b mRNA coinjected (J–L), and 5′UTR MO and hGRN mRNA coinjected (M–O) embryos at 72 hpf. Sections are immunolabeled (cyan) with markers for ganglion cells (Zn-5, left column), red-green double cone photoreceptors (Zpr1, middle column), and amacrine cells (HPC1, right column), EdU (fusia), and DAPI (gray). (P) Histogram showing relative retinal area of UI (17437.4 ± 2286.1 μm2; n = 23; 95% CI: 16970 (14744–19196)), 5′UTR MO-injected (12961.2 ± 2251.8 μm2; n = 21; 95% CI: 11329 (10561–12097)), 5′UTR MO and eGFP mRNA co-injected (10809 ± 2282.5 μm2; n = 8; 95% CI: 14374 (12599–16149)), 5′UTR MO and zf pgrn-a mRNA co-injected (16435.7 ± 2882.2 μm2; n = 12; 95% CI: 16860 (15697–18023)), 5′UTR MO and zf pgrn-b mRNA co-injected (15357.8 ± 2750.2 μm2; n = 13; 95% CI: 14834 (13529–16139)), and 5′UTR MO and hGRN mRNA co-injected (17146.1 ± 2930.7 μm2; n = 12; 95% CI: 18579 (17174–19984)) embryos at 72 hpf; ***p<0.001. (Q) Histogram showing the percent of the retina labeled with EdU in UI (10.5 ± 3.9%; n = 7; 95% CI: 11.0 (7–15)), 5′UTR MO-injected (45 ± 7.9%; n = 18; 95% CI: 45 (41–49)), 5′UTR MO and eGFP mRNA co-injected (41.1 ± 4.5%; n = 6; 95% CI: 41.0 (36–46)), 5′UTR MO and zf pgrn-a mRNA co-injected (15.2 ± 6.8%; n = 22; 95% CI: 15.0 (12–18)), 5′UTR MO and zf pgrn-b mRNA co-injected (20.8 ± 9.6%; n = 18; 95% CI: 21 (16-26)), and 5′UTR MO and hGRN mRNA co-injected (21.8 ± 8.5%; n = 12; 95% CI: 15 (9–21)) embryos at 72 hpf; ***p<0.001. (R) Histogram showing the number of retinal microglia (4C4+ cells) at 72 hpf in UI (95 ± 30.5 cells; n = 23; 95% CI: 95.0 (82.5–107.5)), 5′UTR MO-injected (8.4 ± 6.8 cells; n = 21; 95% CI: 8.4 (5.5–11.3)), 5′UTR MO and eGFP mRNA co-injected (5.4 ± 4.8 cells; n = 8; 95% CI: 5.4 (2.1–8.7)), 5′UTR MO and zf pgrn-a mRNA co-injected (17.7 ± 10.2 cells; n = 12; 95% CI: 17.7 (11.9–23.5)), 5′UTR MO and zf pgrn-b mRNA co-injected (28.9 ± 14.7 cells; n = 13; 95% CI: 28.9 (20.9′36.9)), and 5′UTR MO and hGRN mRNA co-injected (20.6 ± 10.8; n = 12; 95% CI: 20.6 (14.5′26.7)) embryos; ***p<0.001. Quantitative data are represented as mean; error bars represent the standard deviation. Outer nuclear layer (ONL), inner nuclear layer (INL), and ganglion cell layer (GCL); ciliary marginal zone (CMZ, brackets). Scale bar equals 50 µm. |
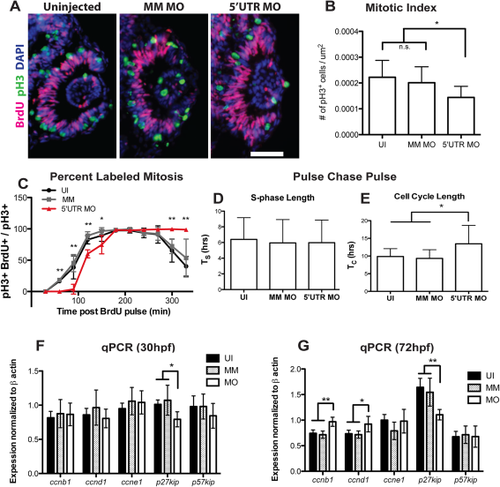
Knockdown of pgrn-a alters cell cycle kinetics in retinal progenitors. (A) Representative retinal sections from 28 hpf uninjected (left panel), MM MO (center panel), and 5′UTR MO (right panel) embryos stained with antibodies against pH3 (green), BrdU (fusia), and DAPI (blue) used for quantification of mitotic index. (B) Histogram showing the mitotic index at 28 hpf. The number of pH3+ cells/unit area in UI (0.0002 ± 1.973e-005 cells per μm2; n = 11; 95% CI: .0002 (−0.00018–0.00058)), MM MO (0.0002 ± 1.947e-005 cells per μm2; n = 10; 95% CI: .0002 (0.000162–0.000238)), and 5′UTR MO retinas (0.0001 ± 1.366e-005 cells per μm2; n = 10; 95% CI: .0001 (0.000073–0.000127)); *p≤0.01. (C) Graph showing the percent labeled mitosis for UI, MM MO and 5′UTR MO embryos between 28 and 35 hpf. (D) Histogram showing average S-phase length (TS) in 26-28 hpf UI (6.4 ± 2.8 hrs; n = 16; 95% CI: 6.4 (5–7.8)), MM MO (5.9 ± 3.0 hrs; n = 10; 95% CI: 6.0 (4.2–7.8)), and 5′UTR MO (6.0 ± 2.9 hrs; n = 7; 95% CI: 6.0 (3.9–8.1)) embryos. (E) Histogram showing average total cell cycle length (TC) at 26-28 hpf in UI (9.9 ± 2.2 hrs; n = 16; 95% CI: 9.9 (8.8–11)), MM MO (9.3 ± 2.5 hrs; n = 10; 95% CI: 9.3 (7.8–10.8)), and 5′UTR MO (13.5 ± 5.2 hrs; n = 7; 95% CI: 13.5 (9.6-17.4)); *p≤0.05. (F–G). |
|
|
|