
Fig. 3
- ID
- ZDB-FIG-170922-28
- Publication
- Walsh et al., 2017 - Progranulin regulates neurogenesis in the developing vertebrate retina
- Other Figures
- All Figure Page
- Back to All Figure Page
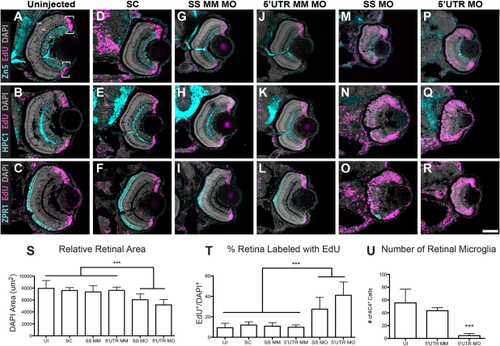
Pgrn-a knockdown results in microphthalmia and diminished neuronal differentiation. (A–R) Sections through central retina of uninjected (UI, A–C); standard control morpholino-injected (SC, D–F); SS MM (G–I) and 5′UTR MM (J–L), embryos injected with 5-nucleotide mismatch control morpholinos; SS MO (M–O) and 5′UTR MO (P–R), embryos injected with e3i3 splice site-targeted or 5′UTR-targeted morpholinos, respectively, at 72 hpf. Sections are immunolabeled (cyan) with markers of differentiated ganglion cells (Zn5, top row), amacrine cells (HPC1, middle row), and red–green double cone photoreceptor cells (ZPR1, bottom row), EdU (fusia), and DAPI (gray). (S) Histogram showing relative retinal area in UI (7945.8 ± 1319.6 μm2; n = 11; CI, 7945 ± 886), SC-injected (7594.3 ± 475.2 μm2; n = 9; 95% CI: 7594 (7229–7959)), SS MM MO-injected (7354 ± 1062.6 μm2; n = 11; 95% CI: 7353 (6640-8066)), and 5′UTR MM MO-injected (7610.8 ± 547.6 μm2; n = 10; 95% CI: 7610 (7219–8001)), SS MO (6044.7 ± 956.2 μm2; n = 10; 95% CI: 6044 (5360–6782)), and 5′UTR MO (5188.7 ± 891.8 μm2; n = 16; 95% CI: 5188 (4713–5663)) retinas at 72 hpf; ***p≤0.001. (T) Histogram showing the percent of the retina labeled with EdU in UI (9.3 ± 4.3%; n = 11; 95% CI: 9.3 (6.4–12.2)), SC-injected (12 ± 3.1%; n = 9; 95% CI: 12.0 (8.7–15.3)), SS MM MO-injected (10.8 ± 3.5%; n = 11; 95% CI: 10.8 (8.7–12.9)), 5′UTR MM MO-injected (9.8 ± 2.3%; n = 10; 95% CI: 9.8 (7.3–12.3)), SS MO-injected (27.5 ± 11.5%; n = 10; 95% CI: 27.6 (25.9–29.3)), and 5′UTR MO-injected (41.1 ± 13%; n = 16; 95% CI: 41.1 (35–47.2)) retinas at 72 hpf; ***p≤0.001. (U) Histogram showing the number of microglia in uninjected (UI; 55.4 ± 21.5 cells; n = 20; 95% CI: 62.4 (51.7–73.1)), 5′UTR mismatch morpholino injected (5′UTR MM; 43.4 ± 4.6 cells; n = 8; 95% CI: 43.4 (39.6–47.2)), and Pgrn-a morphant (5′UTR MO; 4.4 ± 3.4 cells; n = 11; 95% CI: 4.4 (2.1–6.7)) retinas at 72 hpf; ***p≤0.001. Quantitative data are represented as mean; error bars represent the standard deviation. Outer nuclear layer (ONL), inner nuclear layer (INL), and ganglion cell layer (GCL); ciliary marginal zone (CMZ, brackets). Scale bar equals 50 µm. |