
Fig. 5
- ID
- ZDB-FIG-170922-30
- Publication
- Walsh et al., 2017 - Progranulin regulates neurogenesis in the developing vertebrate retina
- Other Figures
- All Figure Page
- Back to All Figure Page
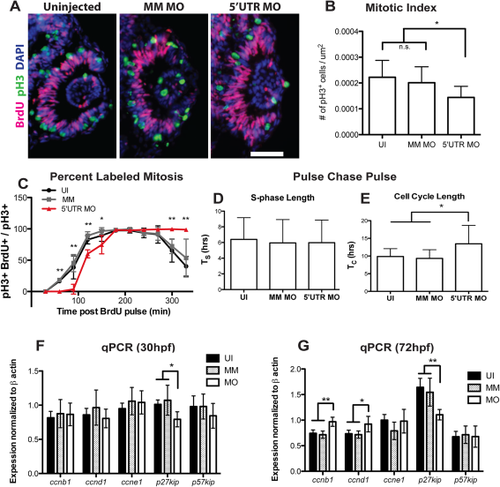
Knockdown of pgrn-a alters cell cycle kinetics in retinal progenitors. (A) Representative retinal sections from 28 hpf uninjected (left panel), MM MO (center panel), and 5′UTR MO (right panel) embryos stained with antibodies against pH3 (green), BrdU (fusia), and DAPI (blue) used for quantification of mitotic index. (B) Histogram showing the mitotic index at 28 hpf. The number of pH3+ cells/unit area in UI (0.0002 ± 1.973e-005 cells per μm2; n = 11; 95% CI: .0002 (−0.00018–0.00058)), MM MO (0.0002 ± 1.947e-005 cells per μm2; n = 10; 95% CI: .0002 (0.000162–0.000238)), and 5′UTR MO retinas (0.0001 ± 1.366e-005 cells per μm2; n = 10; 95% CI: .0001 (0.000073–0.000127)); *p≤0.01. (C) Graph showing the percent labeled mitosis for UI, MM MO and 5′UTR MO embryos between 28 and 35 hpf. (D) Histogram showing average S-phase length (TS) in 26-28 hpf UI (6.4 ± 2.8 hrs; n = 16; 95% CI: 6.4 (5–7.8)), MM MO (5.9 ± 3.0 hrs; n = 10; 95% CI: 6.0 (4.2–7.8)), and 5′UTR MO (6.0 ± 2.9 hrs; n = 7; 95% CI: 6.0 (3.9–8.1)) embryos. (E) Histogram showing average total cell cycle length (TC) at 26-28 hpf in UI (9.9 ± 2.2 hrs; n = 16; 95% CI: 9.9 (8.8–11)), MM MO (9.3 ± 2.5 hrs; n = 10; 95% CI: 9.3 (7.8–10.8)), and 5′UTR MO (13.5 ± 5.2 hrs; n = 7; 95% CI: 13.5 (9.6-17.4)); *p≤0.05. (F–G). |