
|
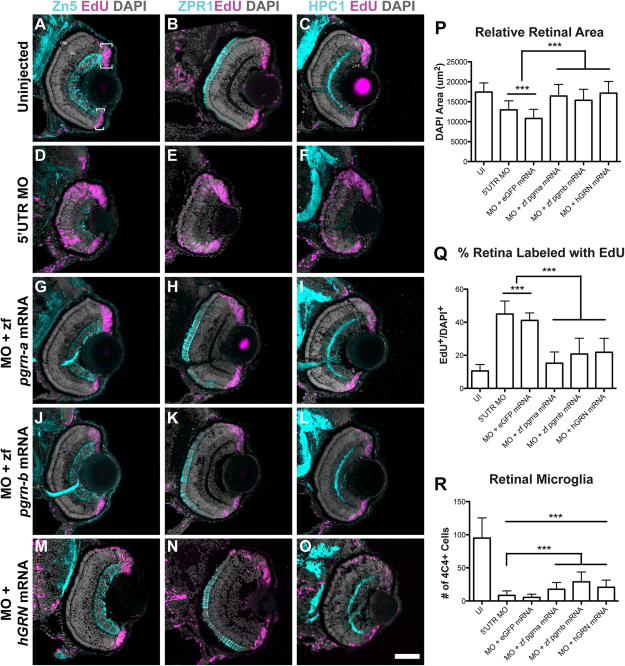
Fig. 4
Coinjection of 5′UTR MO and zf pgrn-a, zf pgrn-b, or hGRN mRNA rescues most aspects of knockdown retinal phenotype. (A–O) Cross-sections through central retina of 72 hpf uninjected (UI, A–C), 5′UTR MO-injected (D–F), 5′UTR MO and zf pgrn-a mRNA coinjected (G–I), 5′UTR MO and zf pgrn-b mRNA coinjected (J–L), and 5′UTR MO and hGRN mRNA coinjected (M–O) embryos at 72 hpf. Sections are immunolabeled (cyan) with markers for ganglion cells (Zn-5, left column), red-green double cone photoreceptors (Zpr1, middle column), and amacrine cells (HPC1, right column), EdU (fusia), and DAPI (gray). (P) Histogram showing relative retinal area of UI (17437.4 ± 2286.1 μm2; n = 23; 95% CI: 16970 (14744–19196)), 5′UTR MO-injected (12961.2 ± 2251.8 μm2; n = 21; 95% CI: 11329 (10561–12097)), 5′UTR MO and eGFP mRNA co-injected (10809 ± 2282.5 μm2; n = 8; 95% CI: 14374 (12599–16149)), 5′UTR MO and zf pgrn-a mRNA co-injected (16435.7 ± 2882.2 μm2; n = 12; 95% CI: 16860 (15697–18023)), 5′UTR MO and zf pgrn-b mRNA co-injected (15357.8 ± 2750.2 μm2; n = 13; 95% CI: 14834 (13529–16139)), and 5′UTR MO and hGRN mRNA co-injected (17146.1 ± 2930.7 μm2; n = 12; 95% CI: 18579 (17174–19984)) embryos at 72 hpf; ***p<0.001. (Q) Histogram showing the percent of the retina labeled with EdU in UI (10.5 ± 3.9%; n = 7; 95% CI: 11.0 (7–15)), 5′UTR MO-injected (45 ± 7.9%; n = 18; 95% CI: 45 (41–49)), 5′UTR MO and eGFP mRNA co-injected (41.1 ± 4.5%; n = 6; 95% CI: 41.0 (36–46)), 5′UTR MO and zf pgrn-a mRNA co-injected (15.2 ± 6.8%; n = 22; 95% CI: 15.0 (12–18)), 5′UTR MO and zf pgrn-b mRNA co-injected (20.8 ± 9.6%; n = 18; 95% CI: 21 (16-26)), and 5′UTR MO and hGRN mRNA co-injected (21.8 ± 8.5%; n = 12; 95% CI: 15 (9–21)) embryos at 72 hpf; ***p<0.001. (R) Histogram showing the number of retinal microglia (4C4+ cells) at 72 hpf in UI (95 ± 30.5 cells; n = 23; 95% CI: 95.0 (82.5–107.5)), 5′UTR MO-injected (8.4 ± 6.8 cells; n = 21; 95% CI: 8.4 (5.5–11.3)), 5′UTR MO and eGFP mRNA co-injected (5.4 ± 4.8 cells; n = 8; 95% CI: 5.4 (2.1–8.7)), 5′UTR MO and zf pgrn-a mRNA co-injected (17.7 ± 10.2 cells; n = 12; 95% CI: 17.7 (11.9–23.5)), 5′UTR MO and zf pgrn-b mRNA co-injected (28.9 ± 14.7 cells; n = 13; 95% CI: 28.9 (20.9′36.9)), and 5′UTR MO and hGRN mRNA co-injected (20.6 ± 10.8; n = 12; 95% CI: 20.6 (14.5′26.7)) embryos; ***p<0.001. Quantitative data are represented as mean; error bars represent the standard deviation. Outer nuclear layer (ONL), inner nuclear layer (INL), and ganglion cell layer (GCL); ciliary marginal zone (CMZ, brackets). Scale bar equals 50 µm.