
- Title
-
Nerves Control Redox Levels in Mature Tissues Through Schwann Cells and Hedgehog Signaling
- Authors
- Meda, F., Gauron, C., Rampon, C., Teillon, J., Volovitch, M., Vriz, S.
- Source
- Full text @ Antioxid. Redox Signal.
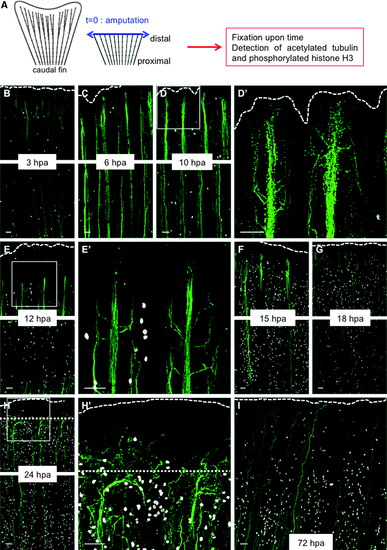
Wallerian degeneration and axon growth after amputation are very rapid in adult fish. (A) Scheme of the experiment. (B–I) Caudal fins of adult fish were amputated (t = 0, blue arrow), and the axon cytoskeleton (green) and mitosis (white) were visualized over time through immunofluorescence staining for the axonal marker, acetylated tubulin (green), and phosphorylated histone H3 (white), respectively. (D′, E′, H′) Show higher magnifications of the distal parts of (D, E, H), respectively. At 6 hpa, the extremities of the axons begin to be fragmented, and the nerves begin to defasciculate; at 10 hpa, defasciculation is more pronounced. During Wallerian degeneration (10–12 hpa), epidermal and SCs start to proliferate. At 15 hpa, axons have regrown, and some axons cross the amputation plane at 18 hpa. Dotted line: amputation plane. Dashed line: distal part of the fin. Before 24 hpa, the amputation plane corresponds to the distal part of the fin. For each time point, the most distal part of the fin (upper panel) and a proximal part (lower panel) are shown. Scale bars = 50 μM. hpa, hours postamputation; SCs, Schwann cells. |
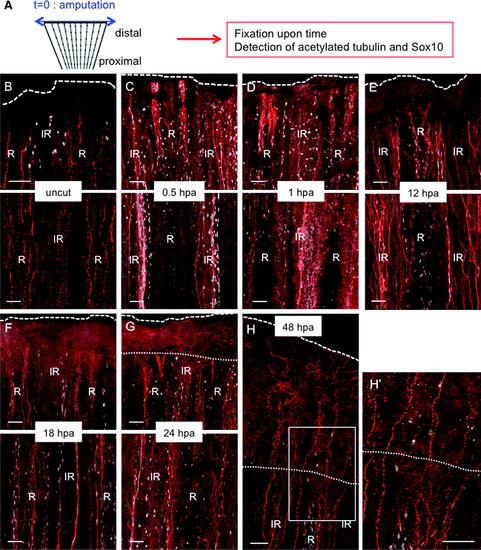
Systemic Sox10 activation in SCs following amputation. (A) Scheme of the experiment. (B–H) Caudal fin of adult fish was amputated (t = 0, blue arrow), and the axon cytoskeleton (red) and immature SCs (white) were visualized over time through immunofluorescence staining for the axonal marker, acetylated tubulin (red), and the immature SC marker, Sox10 (white), respectively. Immunostaining in uncut fin (B) or after amputation (C–H). (B–G) The upper panel shows the distal part of the amputated fin, and the lower panel shows a more proximal part. (H′) Shows a higher magnification of (H). Dotted line: amputation plane. Dashed line: distal part of the fin. Scale bars = 50 μM. R, ray; IR, inter-ray. |
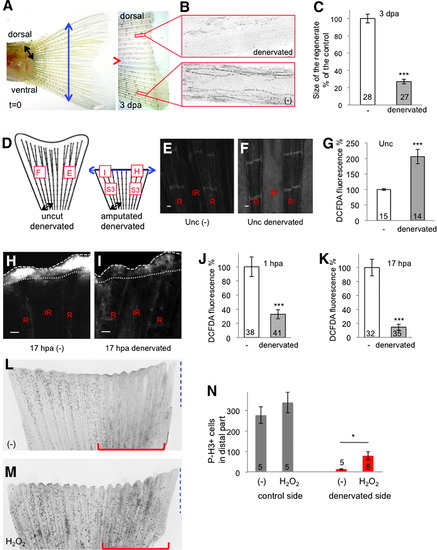
Sensory neurons control ROS levels in the adult caudal fin. (A) The dorsal part of the caudal fin was denervated (black arrow) at the time of amputation (blue arrow). At 3 dpa, the dorsal part (denervated) had not regenerated compared with the ventral part (-) (representative image). (B) At 3 dpa, antiacetylated tubulin staining indicates the absence of axons in the denervated part. (C) Quantification of the size of the regenerated tissue at 3 dpa in the control (-) and denervated parts. The efficiency of regeneration is expressed as a percentage of the control. (D) Schematic representation of ROS detection in fin denervated in the dorsal part, with and without amputation. The squares indicate the position of ROS measurement, and the letters refer to panels in this figure or Supplementary Figure S3. (E–G) ROS detection at the level of the first ray bifurcation in an uncut fin. (H–K) ROS detection at the level of the amputation plane at 1 and 17 hpa. (H, I) Representative images at 17 hpa. (L–N) Mitotic cells were stained with antiphosphorylated histone H3 at 24 hpa in fins denervated at the time of amputation on the dorsal part (red line) and incubated in water (L) or 1 mM (H2O2) (M). Quantification of proliferation was performed on the distal part of the fin (blue dashed line) in the control part or the denervated part (red line) (N). The red line indicates the denervated part. (H, I) Dotted line: amputation plane. Dashed line: distal part of the fin. Error bars represent the SEM (*p < 0.05; ***p < 0.001). n Values are indicated at the bottom of each column of the graphs. Scale bars = 50 μM. A scheme of the different conditions in which ROS were measured is given in Supplementary Figure 2. dpa, days post amputation; H2O2, hydrogen peroxide; ROS, reactive oxygen species; SEM, standard error of the mean. |
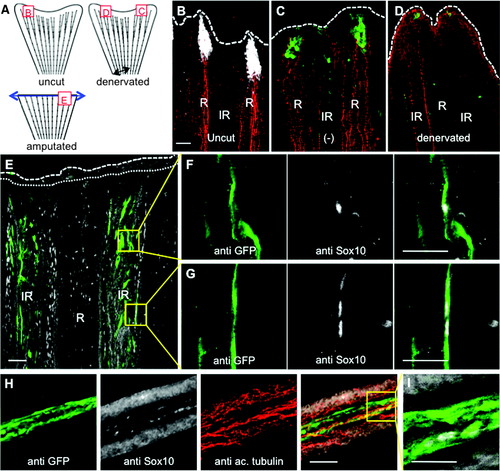
Activated SCs express Shh and form a specific structure at the tip of the axon. (A) Schematic representation of the intact fin or the fin after amputation. The squares indicate the position of the acquisitions, and the letters refer to the figure panels of this figure. The dorsal part of the caudal fin was denervated (black arrow) or the fin was amputated (blue arrow). (B) Immunofluorescence staining for GFP in shh:GFP fish (white) and axon cytoskeleton (red) in uncut fin. (C, D) Immunofluorescence staining for GFP in shh:GFP fish (green) and for the axon cytoskeleton (red) in control side (-) and denervated part of a nonamputated fin 2 days postdenervation. (E–G) Immunofluorescence staining for GFP in shh:GFP fish (green) and Sox10 (white) in the whole fin at 0.5 hpa. (F, G) Magnification of (E). (H, I) Immunofluorescence staining for GFP in shh:GFP fish (green), axon cytoskeleton (red), and Sox10 (white) in a cryosection of a regenerating fin at 12 hpa. (I) Magnification of (H). Confocal images, 1–3 μM. Dotted line: amputation plane. Dashed line: distal part of the fin. Scale bars = 50 μM in (B–H) and 25 μM in (I). GFP, green fluorescent protein. |
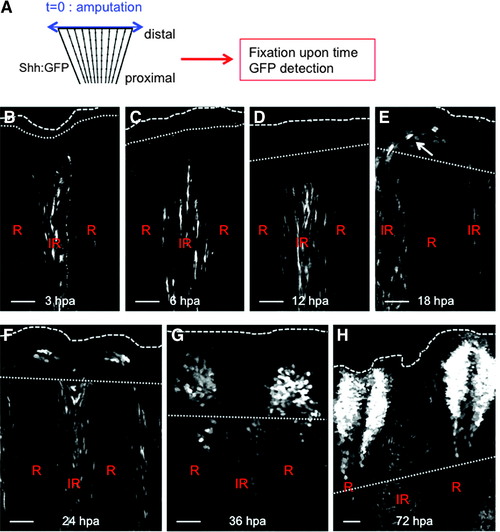
Behavior of Shh-expressing cells during regeneration. (A) Cells expressing Shh were visualized during the time course of regeneration by immunodetection of the GFP in shh:GFP transgenic fish. Until 12 hpa, Shh-positive cells were detected in the inter-ray of the stump (B–D). At 18 hpa, some Shh-positive cells were present at the tip of the regenerating ray (arrow) (E) and their numbers increased over time to reform the structure present in the uncut fin by 48–72 hpa (F–H). Scale bars = 50 μM. Dotted line: amputation plane. Dashed line: distal part of the fin. |
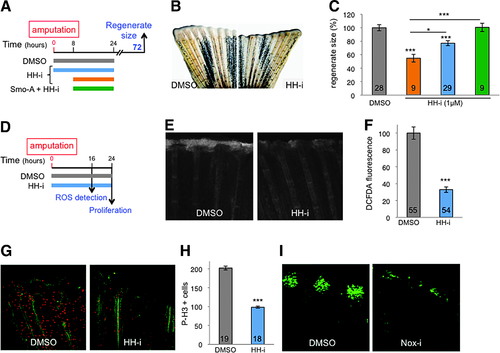
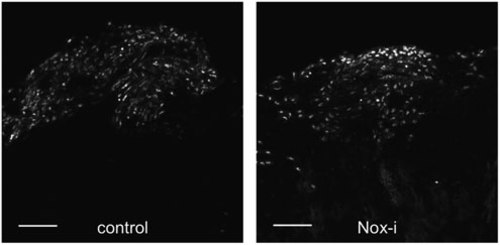
Early HH signaling is necessary for ROS production. (A–C) HH-i added to the water bath from 0 to 24 hpa (blue) or from 8 to 24 hpa (orange) inhibits regeneration, which can be rescued by Smo-A (green). (D–H) Hedgehog inhibition with HH-i (cyclopamine) (D) reduced ROS levels at the amputation plane at 16 hpa (E, F) and stump proliferation at 24 hpa (G, H). (G, H) Immunofluorescence staining for the axonal marker, acetylated tubulin (green), and for the mitotic cell marker, phosphorylated histone H3 (red). (I) Nox-i added to the water bath from 0 to 24 hpa reduced the number of Shh-positive cells detected at 48 hpa. Shh-positive cells were visualized by immunodetection of the GFP in shh:GFP transgenic fish. Error bars represent the SEM (*p < 0.05; ***p < 0.001). n Values are indicated at the bottom of each column of the graphs. HH-i, hedgehog inhibitor, cyclopamine; Smo-A, smoothened agonist. |
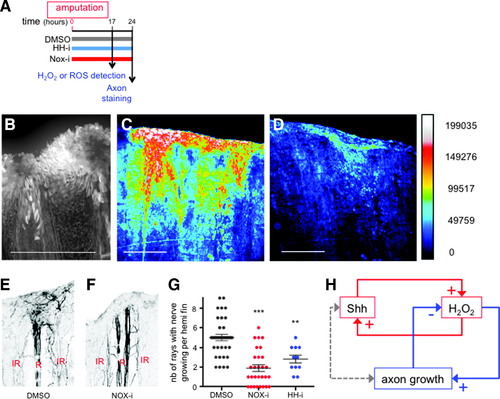
H2O2 stimulates axon growth in a positive feedback loop. (A) Scheme of the experiments. (B) ROS detection with DCFDA fluorescent probe. (C, D) Detection of H2O2 in ubi:HyPer fish. Fish were incubated in water (C) or Nox-i (D) and fluorescence of HyPer analyzed on adult anesthetized fish. [H2O2] is inferred from the YFP500/YFP420 excitation ratio of HyPer. Pseudocolor calibration bars: HyPer ratio (YFP500/YFP420). (E, F) Growing nerves were detected in the regenerating fin at 24 hpa by immunodetection of acetylated tubulin in fish incubated in vehicle (E), Nox-i (F), or HH-i (not shown). The quantification presented in (G) corresponds to the number of rays with growing nerves per half fin (maximum 9). n Values: dimethyl sulfoxide = 36; NOX-i = 29; HH-i = 11. (H) This article reveals the interaction between two feedback loops in the regulation of axon growth. Error bars represent the SEM (**p < 0.01; ***p < 0.001). Scale bars = 200 μM. YFP, yellow fluorescent protein. |
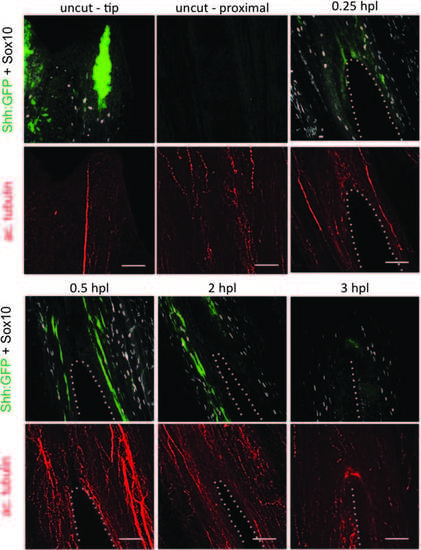
Sox10 and Shh are activated shortly after lesion. Immunofluorescence staining for immature SC marker, Sox10 (white), Shh-expressing cells (anti-GFP, Shh:GFP fish) (green), and the axonal marker, acetylated tubulin (red). A lesion was performed in between the rays. As soon as 0.25 hpl, Sox10-positive and Shhexpressing cells are detected surrounding the lesion. Once the wound is healed (3 hpl), Shh-expressing cells are no longer detectable, whereas several Sox10-positive cells continue to set along the wound. Scale bars = 50 µM. Dotted lines represent the hole generated by the lesion. GFP, green fluorescent protein; hpl, hours postlesion; SC, Schwann cell. |
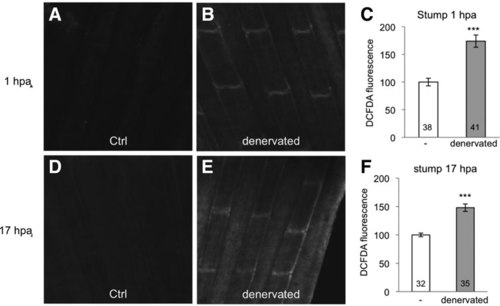
Denervation enhances ROS levels in the stump of amputated fins. The dorsal part of the caudal fin was denervated, and ROS were detected in the stump 1 hpa (A–C) or 17 hpa (D–F) in the denervated or control part. A scheme of the different conditions in which ROS have been measured is given in Supplementary Fig. S2. Error bars represent the SEM (***p < 0.001). hpa, hours postamputation; ROS, reactive oxygen species. |
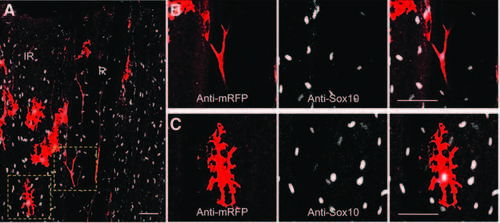
After amputation, Sox10 is detected in neural crest-derived cells (melanocytes and SCs). The caudal fin of a pigmented sox10:mRFP transgenic fish was amputated, and the samples were fixed at 0.5 hpa. (A) Immunofluorescence staining for RFP (sox10:mRFP) (red) and Sox10 (anti-Sox10) (white) was performed. (B, C) Magnifications of (A). (B) Colocalization of mRFP and Sox10 in an SC. (C) Colocalization of mRFP and Sox10 in a melanocyte. Confocal images 1–2 µM; scale bar = 50 µM. |
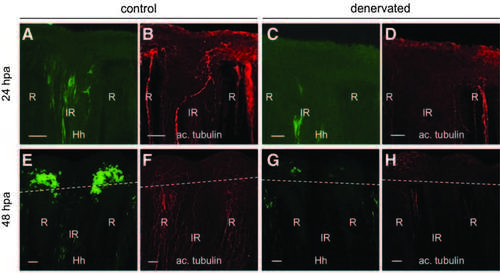
Shh-expressing cell behavior in the time course of regeneration after denervation. Immunofluorescence staining for GFP (shh:GFP) and axons (antiacetylated tubulin) in a control fin (A, B, E, F) and fin denervated in the dorsal part (C, D, G, H) at 24 hpa (A–D) or 48 hpa (E–H). Scale bars = 50 lM. R, ray; IR, inter-ray. Dashed line: amputation plane. |
Superoxide detection with mitoSOX. Fish challenged to regenerate were incubated in mitoSOX with or without Nox-i and fluorescence detected at 17 hpa. Superoxides were detected at the level of the amputation plane. Inhibition of NADPH oxidase does not modify superoxide levels detected with mitoSOX. Scale bars = 50 lM. |