
Image
|
Figure Caption
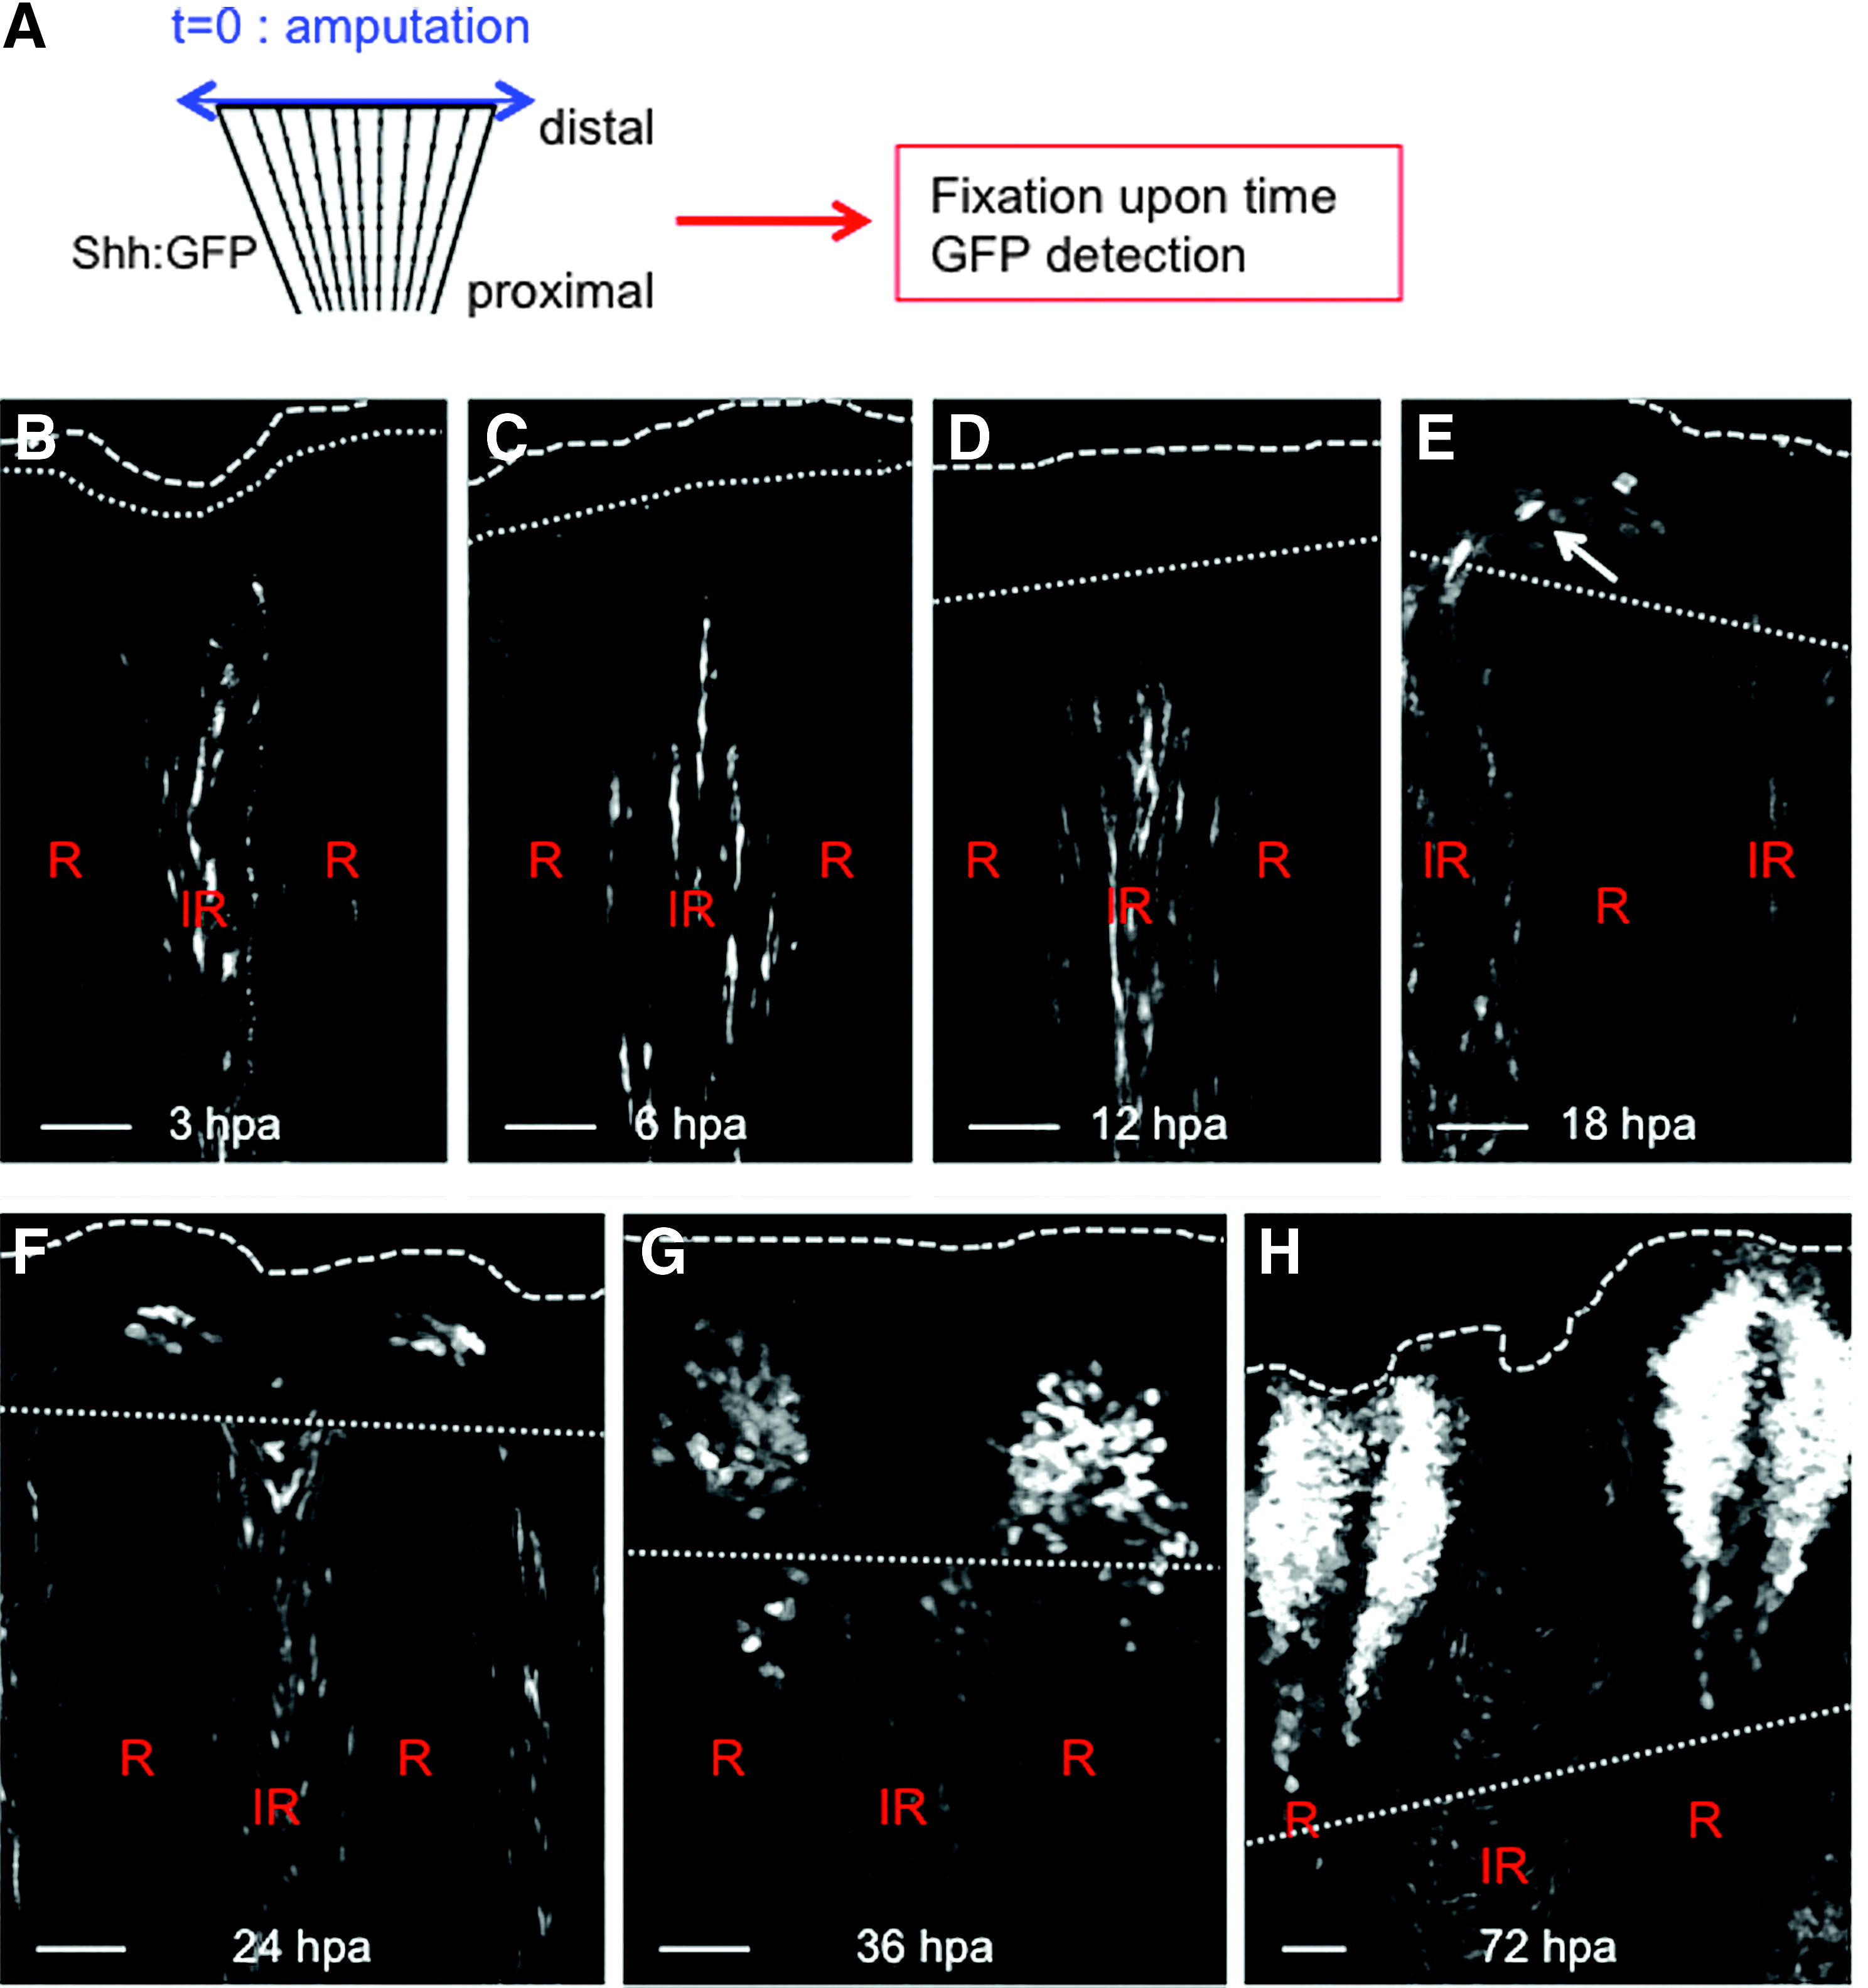
Fig. 5
Behavior of Shh-expressing cells during regeneration. (A) Cells expressing Shh were visualized during the time course of regeneration by immunodetection of the GFP in shh:GFP transgenic fish. Until 12 hpa, Shh-positive cells were detected in the inter-ray of the stump (B–D). At 18 hpa, some Shh-positive cells were present at the tip of the regenerating ray (arrow) (E) and their numbers increased over time to reform the structure present in the uncut fin by 48–72 hpa (F–H). Scale bars = 50 μM. Dotted line: amputation plane. Dashed line: distal part of the fin.
Acknowledgments
This image is the copyrighted work of the attributed author or publisher, and
ZFIN has permission only to display this image to its users.
Additional permissions should be obtained from the applicable author or publisher of the image.
Full text @ Antioxid. Redox Signal.