
- Title
-
An exclusive cellular and molecular network governs intestinal smooth muscle cell differentiation in vertebrates
- Authors
- Gays, D., Hess, C., Camporeale, A., Ala, U., Provero, P., Mosimann, C., Santoro, M.M.
- Source
- Full text @ Development
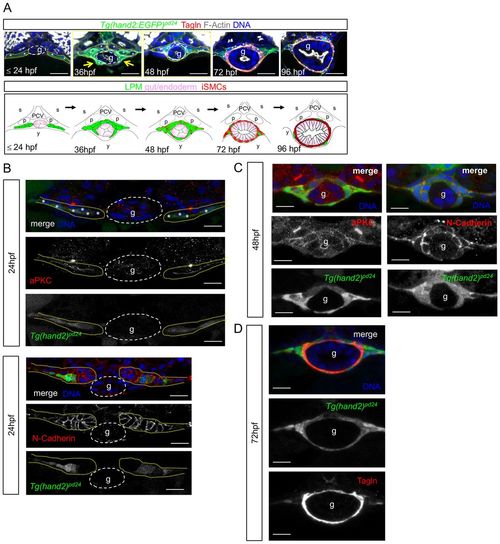
LPM gives rise to iSMCs in zebrafish embryos. (A) Time-course analyses of Tg(hand2:EGFP)pd24 and iSMC marker expression (Tagln) during intestinal development. Tg(hand2:EGFP)pd24 embryos were fixed at different time points from 24 hpf until 96 hpf. Upper panel: confocal transverse sections of the posterior gut region between the somites 7 and 13 of Tg(hand2:EGFP)pd24 embryos stained with phalloidin (gray) and Tagln (red) (single channels are shown in Fig. S1A). The dashed yellow lines highlight LPM/hand2+ cells, whereas the dashed white lines highlight the enteric endoderm (g). Migration of the LPM is indicated by arrows. Asterisks indicate single-cell nuclei. ISMC differentiation is visible during intestinal development by expression of Tagln; blue indicates nuclei; g, gut. Scale bar: 30 μm. Bottom panel: schematic representation of LPM/hand2+ conversion to iSMCs in the gut region of developing zebrafish embryos. Green, LPM; pink, endoderm; red, iSMCs; p, pronephros; s, somite; PCV, posterior cardinal vein; y, yolk. (B) Analyses of Tg(hand2:EGFP)pd24 and polarity and mesenchymal markers during LPM development at 24 hpf. Confocal transverse sections of the posterior gut region between the somites 7 and 13 of Tg(hand2:EGFP)pd24 embryos stained with aPKC or N-cadherin. Nuclei are in blue; g, gut. Scale bars: 30 μm. Asterisks indicate single-cell nuclei while the dashed yellow lines highlight LPM/hand2+ cells. (C) Analyses of Tg(hand2:EGFP)pd24 and polarity and mesenchymal markers during LPM development at 48 hpf. Confocal transverse sections of the posterior gut region between the somites 7 and 13 of Tg(hand2:EGFP)pd24 embryos stained with aPKC (left, red) or N-cadherin (right, red). Blue indicates nuclei; g, gut. Scale bars: 30 μm. (D) Analyses of Tg(hand2:EGFP)pd24 and iSMC marker expression (Tagln) at 72 hpf. Confocal transverse sections of the posterior gut region between the somites 7 and 13 of Tg(hand2:EGFP)pd24 embryos stained with Tagln (red) show that all differentiated iSMC are also Tg(hand2:EGFP)pd24 positive. These observations suggest that posterior LPM expression of hand2 does not demarcate the entire LPM, but rather is confined to the presumptive iSMC progenitors from its expression onset after LPM formation. Nuclei are in blue; g, gut. Scale bars: 30 μm. |
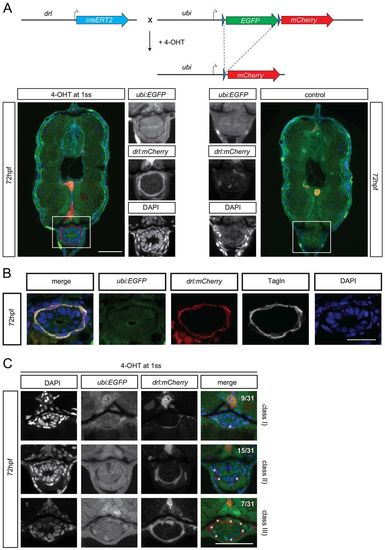
drl-positive LPM cells give rise to iSMC. (A) Schematic of the drl:creERT2×ubi:lox-EGFP-lox-mCherry (ubi:switch) crosses. Double-positive embryos were induced at the one-somite stage with 4-OH tamoxifen (10 µM final concentration). This activates the Cre recombinase, which then excises the loxP-flanked EGFP cassette and brings mCherry under control of the ubi promoter to lineage trace the switched cells. Photomicrographs of transverse vibratome sections of posterior trunk region (dr:creERT2;ubi:Switch) are shown below. Sections were imaged with a Zeiss LSM710 40× objective. Scale bar: 50 µm. Higher magnification of the intestinal region. The merged channel comprises EGFP, mCherry and DAPI. (B) Transverse vibratome sections of the posterior trunk region (dr:creERT2;ubi:Switch). Higher magnifications of the intestinal region. iSMCs are stained using transgelin antibody to compare with lineage labeling by drl:creERT2. Scale bar: 30 µm. The merged channel comprises EGFP, mCherry and DAPI. (C) Transverse vibratome sections of the posterior trunk region (drl:creERT2xubi:switch). Higher magnification of the intestinal region showing the different switching efficacy for iSMCs after 4-OH treatment at the one-somite stage. Class I, few iSMC are switched; class II, half iSMC are switched; class III, the entire population of iSMCs surrounding the gut are switched. The occurrences of the switching efficacies are: class I, 28% (9/31); class II, 50% (15/31); class III, 22% (7/31). Asterisks indicate switched iSMCs. Sections were imaged with a Zeiss LSM710 40× objective. Scale bar: 25 µm. The merged channel comprises EGFP, mCherry and DAPI. EXPRESSION / LABELING:
|
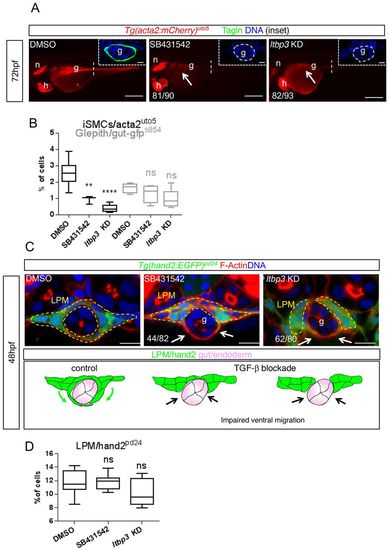
LPM migration is guided by TGFβ signaling. (A) Pharmacological and genetic TGFβ signaling blockade impairs iSMC differentiation. Fluorescent images of Tg(acta2:mCherry)uto5 embryos treated with SB431542 (a TGFβ type I receptors inhibitor) or ltbp3 knockdown (encoding a protein that regulates the bioavailability of TGFβ ligands) exhibit no or few iSMCs, as evaluated by mCherry and Tagln expression in the gut region (g) (arrow) at 72 hpf. Scale bars: 200 μm. n, notochord; h, heart. Insets show confocal transverse sections of posterior gut regions (dashed vertical line) of SB431542-treated embryos and embryos injected with ltbp3 morpholino and stained for Tagln (green). The numbers of embryos showing the phenotype are indicated. Blue indicates nuclei. Scale bars in insets: 10 μm. (B) Alk5 blockade does not affect endoderm development and differentiation. Box and whisker plots show the percentage of iSMCs or endodermal cells isolated by fluorescent-activated cell sorting (FACS) experiments from the trunks spanning from somite 1 to 13 of the double Tg(acta2:mCherry)uto5 (Xia.Eef1a1:GFP)s854 embryos at 72 hpf after chemical (SB431542) or genetic (ltbp3 KD) Alk5 signaling blockade. The boxplots show the maximum, minimum, upper and lower quartiles, and the sample median. Asterisks represent the results of one-way ANOVA-Dunnett's post-hoc test (**P<0.01, ****P<0.0001; from left to right: n=8, n=3, n=5, n=5, n=5 and n=5 groups of 10-20 embryos). (C) Blockade of TGFβ signaling impairs LPM migration. Upper panel: confocal transverse sections of Tg(hand2:EGFP)pd24 stained with phalloidin (red) and Hoechst (blue) showing a reduced LPM migration at 48 hpf (arrows) after TGFβ inhibition. Scale bars: 15 μm. The number of embryos exhibiting this phenotype is indicated. Lower panel: schematic representation of impaired LPM migration (black arrows) observed with the lack of TGFβ signaling in zebrafish embryos. Green, LPM; pink, endoderm. (D) Alk5 blockade does not affect LPM. Box and whisker plots show the percentage of LPM cells isolated by fluorescent-activated cell sorting (FACS) experiments from the trunks of Tg(hand2:EGFP)pd24 embryos at 48 hpf after chemical (SB431542) or genetic (ltbp3 KD) Alk5 signaling inhibition. The boxplots show the maximum, minimum, upper and lower quartiles, and the sample median. From left to right: n=13, n=18 and n=10 groups of 10-20 embryos. EXPRESSION / LABELING:
PHENOTYPE:
|
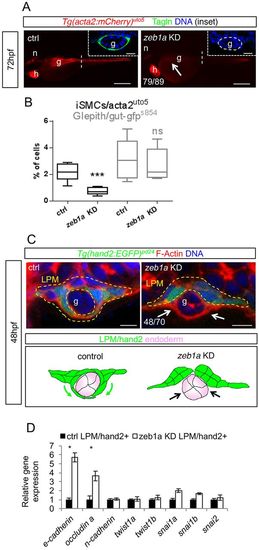
TGFβ-driven LPM morphogenesis requires zeb1a. (A) Knockdown of the transcription factor zeb1a impairs iSMC differentiation. Fluorescent images of Tg(acta2:mCherry)uto5 embryos at 72 hpf after zeb1a morpholino injections. zeb1a knockdown embryos exhibit decreased mCherry and Tagln expression in the gut region (g) compared with controls (arrow). Scale bars: 200 μm. Insets show confocal transverse sections of the posterior gut region (dashed line) in embryos stained for Tagln (green). The number of embryos exhibiting the phenotype is indicated. Nuclei are in blue. Scale bars in insets: 10 μm. n, notochord; h, heart. (B) Knockdown of zeb1a does not alter endoderm morphology and differentiation. Box and whisker plots show the percentage of iSMCs or endodermal cells isolated by fluorescent-activated cell sorting (FACS) experiments from the trunk of double Tg(acta2:mCherry)uto5 (Xia.Eef1a1:GFP)s854 embryos at 72 hpf after zeb1a downregulation. Although the number of iSMCs is severely reduced by zeb1a knockdown, endodermal cells are normal. The boxplots show the maximum, minimum, upper and lower quartiles, and the sample median. Asterisks represent the results of unpaired t-tests of mean difference=0 (***P<0.001; n=6 groups of 10-20 embryos). (C) Knockdown of zeb1a impairs LPM ventral migration. Upper panel: confocal transverse sections of Tg(hand2:EGFP)pd24 stained with phalloidin (red). The number of embryos exhibiting this phenotype is indicated. Scale bars: 15 μm. Lower panel: schematic representation of impaired migration in zeb1a knockdown embryos. (D) zeb1a differentially regulates expression of genes associated with migrating phenotypes in LPM. Histograms show qPCR analyses of defined genes in LPM cells sorted from Tg(hand2:EGFP)pd24 after zeb1a knockdown and the relative controls at 48 hpf. Compared with controls, the knockdown of zeb1a upregulates genes (such as E-cadherin and occludin A) associated with non-migrating epithelial structures (*P<0.05). EXPRESSION / LABELING:
PHENOTYPE:
|
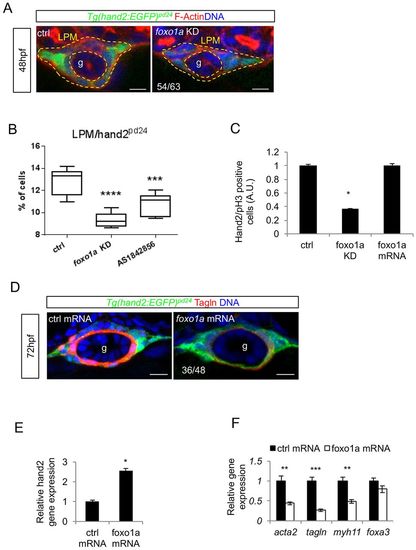
Foxo1a is required for LPM commitment to iSMC differentiation. (A) foxo1a knockdown reduces the number of LPM cells without affecting migration. Confocal transverse sections of the gut (g) in Tg(hand2:EGFP)pd24 embryos injected with foxo1a morpholino and stained for phalloidin (red) at 48 hpf. The number of embryos showing fewer LPM cells is indicated. Nuclei are in blue. Scale bars: 15 μm. (B) Pharmacological and genetic foxo1a inhibition affect LPM. Box and whisker plots show the percentage of LPM cells isolated by fluorescent-activated cell sorting (FACS) experiments from trunks of Tg(hand2:EGFP)pd24 embryos 48 hpf after chemical (AS1842856) or genetic (foxo1a knockdown) foxo1a blockage. The boxplots show the maximum, minimum, upper and lower quartiles, and the sample median. Asterisks represent the results of one-way ANOVA-Dunnett's post-hoc test (***P<0.001, ****P<0.001; from left to right: n=12, n=6 and n=9 groups of 10-20 embryos). (C) foxo1a knockdown impaired LPM proliferation. The histogram shows the normalized count of pH3-positive cells in the LPM of Tg(hand2:EGFP)pd24 embryos at 48 hpf after foxo1a knockdown or overexpression (*P<0.05). (D) foxo1a mRNA overexpression blocks iSMC differentiation. Confocal transverse sections of Tg(hand2:EGFP)pd24 embryos at 72 hpf overexpressing foxo1a mRNA and stained for Tagln (red). The number of embryos exhibiting the phenotype is indicated. Nuclei are in blue. Scale bars: 15 μm. (E) foxo1a mRNA overexpression increases hand2 expression. Histograms show hand2 mRNA levels measured by qRT-PCR in foxo1a-overexpressing embryos compared with controls at 48 hpf (*P<0.05). (F) foxo1a mRNA overexpression affect iSMC marker expression. Histograms show acta2, tagln, myh11 and foxa3 mRNA levels measured by qRT-PCR in foxo1a-overexpressing embryos compared with controls at 72 hpf. The expression of endodermal marker foxa3 is not altered (**P<0.01, ***P<0.001). EXPRESSION / LABELING:
PHENOTYPE:
|
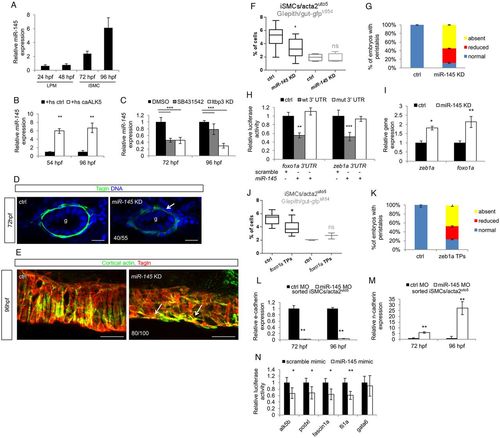
Zeb1a and Foxo1a are regulated by the TGFβ-dependent miR-145 expression. (A) miR-145 expression occurs from 72 hpf onwards in zebrafish embryos. Time-course analysis of miR-145 expression in whole zebrafish embryos. qPCR was performed on total RNA extracted from embryos at the indicated developmental stages. Values are normalized to miR-145 levels in unfertilized eggs. (B) Alk5 activation promotes miR-145 transcription and maturation. Histograms show the levels of mature miR-145 after activation of Alk5 signaling using the inducible Tg(hsp70:caALK5) line, as assessed by qRT-PCR analyses. (C) Blockade of Alk5 signaling significantly reduced mature miR-145 levels. Histograms show the levels of mature miR-145 after pharmacological (SB431542) and genetic (ltbp3 knockdown) inactivation of Alk5 signaling compared with controls, as assessed by qRT-PCR. (D) miR-145 knockdown in zebrafish embryos impairs iSMC maturation. Confocal transverse sections of miR-145 knockdown embryos stained for Tagln (green). Knockdown of miR-145 alters iSMC maturation as displayed by irregular morphology and shape of iSMCs compared with controls (arrow). The number of embryos exhibiting this phenotype is indicated. Nuclei are in blue. Scale bars: 15 μm. (E) miR-145 knockdown alters iSMC organization in the intestine. Confocal maximum projection of iSMCs covering the gut after staining for Tagln (green) and cortical actin (red). miR-145 knockdown embryos showed abnormal endoderm coverage and iSMC morphology (arrows) compared with controls. The number of embryos exhibiting this phenotype is indicated. Scale bars: 25 μm. (F) miR-145 knockdown reduces iSMC number without affecting endoderm differentiation. Box and whisker plots show the percentage of iSMCs and endodermal cells isolated by fluorescent-activated cell sorting (FACS) experiments from the trunks of double Tg(acta2:mcherry)uto5 (Xia.Eef1a1:GFP)s854 embryos at 96 hpf after miR-145 knockdown. The boxplots show the maximum, minimum, upper and lower quartiles, and the sample median. Asterisks represent the results of unpaired t-tests of mean difference=0 (*P<0.05; from left to right: n=10, n=10, n=5 and n=5 groups of 10-20 embryos). (G) Loss of miR-145 impairs gut peristalsis in zebrafish embryos. Histograms show the percentage of embryos with peristaltic gut movement at 96 hpf after miR-145 knockdown. (H) Zebrafish zeb1a and foxo1a mRNA are directly bound by miR-145. The histogram shows luciferase activity in mammalian cells co-transfected with reporter constructs containing wild-type or mutant (mut) zeb1a and foxo1a 3′ UTR, together with a miR-145 mimic or a scramble mimic. The results are shown as the mean±s.d. of Firefly luciferase activity relative to the controls, normalized with respect to Renilla luciferase activity. Asterisks represent the results of one-way ANOVA-Dunnett's post-hoc test (**P<0.01, ***P<0.001). (I) miR-145 knockdown increases foxo1a and zeb1a levels as evaluated by qPCR on the trunk region of embryos at 96 hpf (*P<0.05, **P<0.01). (J) The block of miR-145 and foxo1a binding in vivo reduces iSMC number without affecting endoderm differentiation. Box and whisker plots show the percentage of iSMCs or endodermal cells isolated by fluorescent-activated cell sorting (FACS) experiments from the trunk of the double Tg(acta2:mCherry)uto5 (Xia.Eef1a1:GFP)s854 embryos at 96 hpf after foxo1a target protector (TPs) injection. The boxplots show the maximum, minimum, upper and lower quartiles, and the sample median. Asterisks represent the results of unpaired t-tests of mean difference=0 (*P<0.05; from left to right: n=7, n=7, n=3 and n=3 groups of 10-20 embryos). (K) Block of miR-145-zeb1a binding in vivo affects gut peristalsis in zebrafish embryos. Histograms show the percentage of embryos with peristaltic gut movement at 96 hpf after zeb1a TP injections. (L,M) miR-145 knockdown upregulates the mesenchymal program in iSMCs. Histograms show E-cadherin (L) and N-cadherin (M) mRNA levels evaluated by qRT-PCR in iSMCs sorted from Tg(acta2:mCherry)uto5 embryos after miR-145 knockdown compared with control levels at 72 and 96 hpf. miR-145 knockdown severely reduced E-cadherin mRNA levels but promoted N-cadherin mRNA expression. These data suggest that miR-145 is required to switch off the mesenchymalization program in iSMCs responsible for their appearance (**P<0.01). (N) miR-145 directly targets Alk5 and several genes required for pEMT. Histograms show relative luciferase activity in cells co-transfected with reporter constructs containing the 3′ UTR of alk5, podxl, fascin1a, fli1a and gata6 together with a miR-145 mimic or a scramble mimic. The results are shown as the mean±s.d. of Firefly luciferase activity relative to controls, normalized to Renilla luciferase activity. The data indicate that miR-145 targets the Alk5 receptor, as well as other mesenchymal genes, such as podxl, fascin and fli1a (*P<0.05, **P<0.01). gata6, a known miR-145 target, was used as a control. |
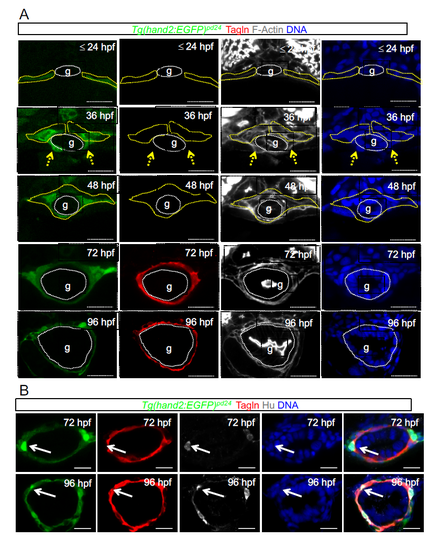
Time course analyses of Tg(hand2:EGFP)pd24 and iSMC marker expression during intestine development. a) Time course analyses of Tg(hand2:EGFP)pd24 and iSMC marker expression (Tagln) during intestine development. Confocal transverse sections of the gut region between the somites 7 and 13 of Tg(hand2:EGFP)pd24 embryos from 24 hpf to 96 hpf as indicated and stained with phalloidin (grey) and Tagln (red). Enteric endoderm is highlight with dashed white line. The yellow dashed line highlights LPM/hand2+ cells. These panels are referring to Figure 1a. Blue = nuclei. Scale bar, 30 μm. Gut: g; LPM: lateral plate mesoderm. b) LPM-derived enteric neurons show high levels of hand2 expression. Confocal transverse sections of the gut region between the somites 7 and 13 of Tg(hand2:EGFP)pd24 embryos stained for the enteric neuron marker Hu (gray) and Tagln (red) at 72 and 96 hpf. Select LPM/hand2+ cells express strong levels of hand2 and become enteric neurons (arrows). Blue = nuclei. Scale bar, 20 μm. |
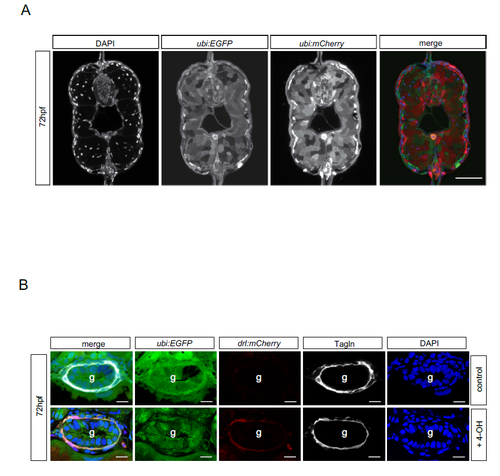
Lineage tracing efficiency using Tg ubi:creERT2 and drl:creERT2. a) Transverse vibratome-sections of posterior trunk region (ubi:creERT2;ubi:Switch). An ubiquitous creERT2 driver line has a switching efficacy of 60-70%. Sections were imaged with the Zeiss LSM710 40x objective (scale bar 50µm). The merged channel composes EGFP, mCherry and DAPI. b) Transverse vibratome-sections of posterior trunk region (dr:creERT2;ubi:Switch). Close ups of intestinal region. iSMCs are stained via Transgelin antibody to compare with lineage labeling by drl:creERT2 (scale bar 15µm). The merged channel composes EGFP, mCherry, Tagln and DAPI. Blue = nuclei. Scale bar, 20 μm. |
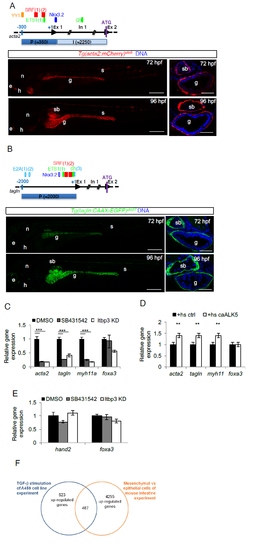
TGF-β is required for LPM-to-iSMC differentiation. a) Tg(acta2:mCherry)uto5 line marks iSMCs. Schematic representation of the zebrafish acta2 minimal promoter region (P) and first intron (I) used to generate the Tg(acta2:mCherry)uto5 line. The SM-relevant transcriptional regulatory elements conserved between zebrafish, humans and mice are depicted. They are: ying yang1, YY1, serum response factor, SRF, v-ets avian erythroblastosis virus E26 oncogene homolog 1, ETS-1, and NK3 homeobox 2, Nkx3.2,. Scores and alignments are shown in Supplementary Table 1. Representative confocal images of whole embryos and of trunk sections show mCherry expression in the intestinal SMCs at the indicated developmental stages. Ectopic mCherry expression is also detected in the lateral line, anterior notochord, heart and few somites. Blue= DNA. Scale bars: left 200 μm and right 30 μm. e= eye; n= notochord; h= heart; g= gut; s= somite; sb= swim bladder. b) Tg(tagln:CAAX-EGFP)uto37 line marks iSMCs. Schematic representation of the zebrafish tagln promoter region (P) used to generate the Tg(tagln:CAAX-EGFP)uto37 line. The SM-relevant transcriptional regulatory elements (TFBSs) YY1, SRF, ETS, transcription factor E2-alpha, E2A and Nkx3.2 conserved between fishes are depicted. Empty boxes show TFBSs conserved between at least 2 species, whereas filled boxes represent TFBSs conserved between all fishes considered in the study (i.e., zebrafish, medaka, stickleback and tetraodon). Scores and alignments are shown in Supplementary Table 1. Representative confocal images of whole embryos and of trunk sections show a membrane localized EGFP expression in the intestinal SMCs at the indicated developmental stages. Ectopic EGFP expression is also detected in the lateral line, anterior notochord, heart and few somites Blue= DNA. Scale bars: left 200 μm and right 30 μm. e= eye; n= notochord; h= heart; g= gut; s= somite; sb= swim bladder. c) TGF-β signaling inhibition blocks iSMC marker expression. Histograms show acta2, tagln, myh11, and foxa3 mRNA levels measured by qRT-PCR in the trunk of 72 hpf embryos after pharmacological and genetic TGF-β signaling blockade. The iSMC markers acta2, tagln and myh11 were significantly downregulated, whereas the endodermal marker foxa3 was only partially affected. Stars represent the results of one way-ANOVA-Dunnett's Post Hoc test (*p<0.05, **p<0.01, ***p<0.001). d) TGF-β signaling promotes iSMC marker expression. Histograms show acta2, tagln, myh11, foxa3 mRNA levels measured at 72 hpf in the trunk of Tg(hsp70:caALK5) embryos by qRT-PCR after Alk5 activation. The iSMC markers acta2, tagln and myh11 were upregulated, whereas the endodermal marker foxa3 was unaffected. Stars represent the results of one way-ANOVA-Dunnett's Post Hoc test (*p<0.05, **p<0.01, ***p<0.001). e) TGF-β signaling inhibition does not alter LPM differentiation. Histograms show hand2 and foxa3 mRNA levels in the trunk of 48 hpf embryos measured by qRT-PCR after pharmacological and genetic TGF-β signaling blockage. TGF-β blockade does not alter the LPM (hand2-positive cells) or endodermal (foxa3-positive cells) compartment. Stars represent the results of unpaired t-tests of mean difference = 0 (*p<0.05, **p<0.01, ***p<0.001) f) Venn diagram showing the strategy for the selection of zeb1a and foxo1a as genes regulated by TGF-β and expressed in the embryonic intestinal mesenchyme. Briefly, intestinal mesenchymal genes were defined by analyzing the microarray data of Li et al. (Li et al., 2007). We then selected those expressed only in the intestinal mesenchyme that could be regulated by TGF-β by analyzing the microarray data of Sartor et al. (Sartor et al., 2010). A total of 487 genes were found. |
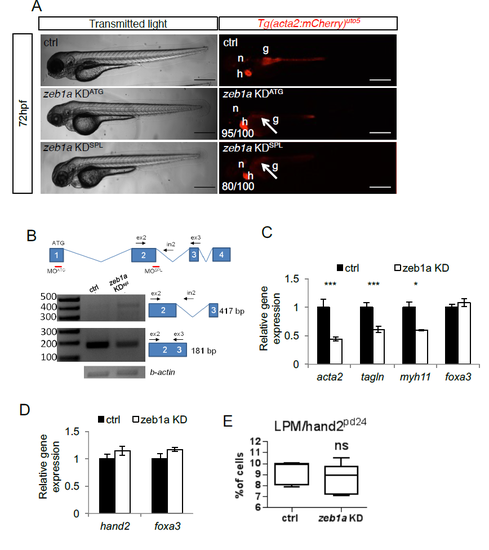
zeb1a is required to develop iSMCs in zebrafish embryos. a) zeb1a knockdown impairs iSMC development. Bright-field and fluorescent images of Tg(acta2:mCherry)uto5 embryos injected with two different morpholinos (KDATG and KDspl). Zeb1a KD in zebrafish did not alter embryonic development, although small moderate pericardial edema and craniofacial abnormalities were evident at 72 hpf. By contrast, zeb1a-deficient embryos displayed no iSMC development, as shown in Tg(acta2:mCherry)uto5-injected embryos (arrows). The number of embryos showing the phenotype is indicated. Scale bar, 200 μm. Notochord: n; heart: h. b) Schematic diagram of the first 4 zeb1a exons (not to scale) showing the locations of binding sites of two different zeb1a morpholinos, one targeting the initiation codon (KDATG) and the other targeting the spice donor site for intron 2 (KDspl). Black arrows indicate the primer used. As shown in the RT-PCR experiments, zeb1a KDspl-injected embryos displayed altered zeb1a wild-type mRNA expression. c) zeb1a knockdown reduces iSMC marker expression. Histograms show acta2, tagln, myh11, and foxa3 mRNA levels in the trunk of 72 hpf embryos measured by qRT-PCR after zeb1a KD. The iSMC markers acta2, tagln and myh11 were significantly downregulated, whereas the endodermal compartment (foxa3) was normal. Stars represent the results of unpaired t-tests of mean difference = 0 (*p<0.05, **p<0.01, ***p<0.001). d) zeb1a knockdown does not alter LPM and endodermal differentiation. Histograms show that the hand2 and foxa3 mRNA levels measured in the trunks of 48 hpf embryos by qRT-PCR after zeb1a KD were equal to control levels. Stars represent the results of unpaired t-tests of mean difference = 0 (*p<0.05, **p<0.01, ***p<0.001) e) zeb1a knockdown does not alter LPM/hand2+ cell number. Box and whisker plots show the percentage of LPM cells isolated by fluorescent-activated cell sorting (FACS) experiments from the trunks of Tg(hand2:EGFP)pd24 embryos at 48 hpf after zeb1a KD. Zeb1a KD did not alter LPM/hand2+ cell number. The boxplots show the maximum, minimum, upper and lower quartiles, and the sample median. Stars represent the results of unpaired t-tests of mean difference = 0 (*p<0.05, **p<0.01, ***p<0.001). (Left to right) n = 5 and n = 10 groups of 10-20 embryos. |
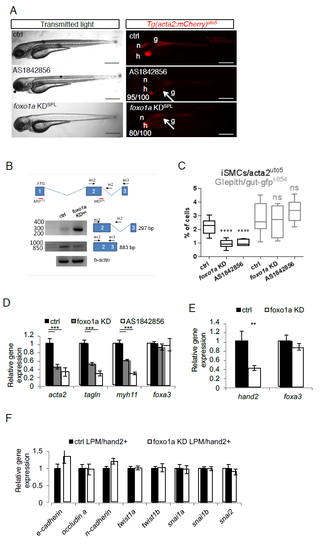
foxo1a KD impairs iSMC differentiation in zebrafish embryos. a) Pharmacological and genetic inactivation of foxo1a impairs iSMC development. Bright-field and fluorescent images of Tg(acta2:mCherry)uto5 embryos treated with the Foxo1 inhibitor AS1842856 or injected with a foxo1a morpholino (KDspl). While pharmacological or genetic foxo1a inhibition in zebrafish did not alter embryonic development, Foxo1a-deficient embryos displayed impaired iSMC development (arrow), as shown in the embryos injected with Tg(acta2:mCherry)uto5. The number of embryos exhibiting the phenotype is indicated. Scale bar, 200 μm. Notochord: n; heart: h; gut: g. b) Schematic diagram of the three foxo1a exons (not to scale) showing the locations of binding sites of two different foxo1a morpholinos, one targeting the initiation codon (KDATG) and the other targeting the spice donor site for intron 2 (KDspl). Black arrows indicate the primer used. As shown in the RT-PCR experiments, foxo1a KDspl-injected embryos exhibited reduced foxo1a wild-type mRNA expression and increased levels of the intron 2-containing form. c) Pharmacological and genetic inactivation of foxo1a impairs iSMC cell number. Box and whisker plots showing the percentage of iSMCs or endodermal cells isolated by fluorescence-activated cell sorting (FACS) experiments from the trunk of double Tg(acta2:mCherry)uto5 (Xia.Eef1a1:GFP)s854 embryos at 72 hpf after chemical (AS1842856) or genetic (foxo1a KD) foxo1a blockage. foxo1a KD impaired iSMC development but did not affect endoderm differentiation. The boxplots show the maximum, minimum, upper and lower quartiles, and the sample median. Stars represent the results of one way-ANOVA-Dunnett's Post Hoc test (*p<0.05, **p<0.01, ***p<0.001). (Left to right) n = 10, n = 6, n = 6, n = 10, n = 4, and n = 6 groups of 10-20 embryos. d) Pharmacological and genetic inactivation of foxo1a impairs iSMC marker expression. mRNA levels of acta2, tagln, myh11, and foxa3 were measured in 72 hpf embryos by qRT-PCR after foxo1a blockade. iSMC markers were significantly downregulated, whereas the endodermal marker foxa3 was expressed normally. Stars represent the results of one way-ANOVA-Dunnett's Post Hoc test (*p<0.05, **p<0.01, ***p<0.001) e) Genetic inactivation of foxo1a affects LPM differentiation. Histograms showing hand2 and foxa3 mRNA levels measured in 48 hpf embryos by qRT-PCR after foxo1a KD. Foxo1a KD impaired the LPM (hand2-positive cells) but did not alter the endoderm (foxa3-positive cells), indicating a specific function for foxo1a in LPM homeostasis. Stars represent the results of unpaired t-tests of mean difference = 0 (*p<0.05, **p<0.01, ***p<0.001) f) foxo1a inactivation does not alter LPM mesenchymalization. Histograms showing qPCR analyses of EMT-related genes in LPM cells sorted from Tg(hand2:EGFP)pd24 after foxo1a KD and controls at 48 hpf. Stars represent the results of unpaired t-tests of mean difference = 0 (*p<0.05, **p<0.01, ***p<0.001). |
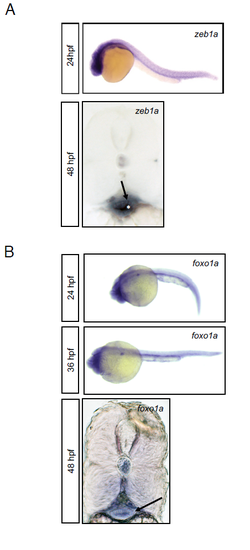
zeb1a and foxo1a are expressed in the LPM during development, although not exclusively. Embryos were probed for endogenous zeb1a a) and foxo1a b) expression by WISH. At 24hpf zeb1a and foxo1a probes show positive staining in the gut region throughout the embryo. Transverse vibratome sections of posterior trunk region at 48hpf showed zeb1a and foxo1a mRNA localized in the area of the gut where LPM are supposed to differentiate in iSMCs (arrows). |
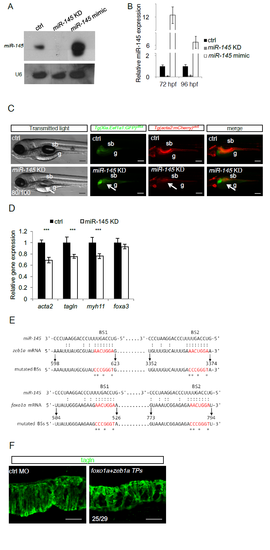
zeb1a and foxo1a are miR-145 targets. a) Northern blot analyses of mature miR-145 levels in embryos injected with miR-145 morpholinos or miR-145 mimic to downregulate or overexpress miR-145, respectively. U6 snRNA was used for normalization. b) miR-145 expression can be modulated in vivo. Histograms show miR-145 levels measured by qRT-PCR in embryos injected with a morpholino blocking the mature miR-145 (miR-145 KD) and with amiR-145 mimic to overexpress miR-145 at 72 and 96 hpf. c) Knockdown of miR-145 induces a peculiar iSMC phenotype in zebrafish embryos. Bright-field and fluorescent images of double Tg(Xia.Eef1a:GFP)s854 Tg(acta2:mCherry)uto5 embryos injected with miR-145 morpholino in zebrafish embryos. While miR-145 KD did not alter embryonic development, miR-145-deficient embryos display reduced SMC-specific Tg expression around the gut and swim bladder (sb), as shown in Tg(acta2:mCherry)uto5 injected embryos (arrow). Scale bar, 200 μm. Notochord: n; swim bladder: sb; gut: g. d) Histograms show acta2, tagln, myh11, and foxa3 mRNA levels measured in the trunk of 96 hpf embryos by qRT-PCR after miR-145 KD. The iSMC markers acta2, tagln and myh11 were partially downregulated, whereas the endodermal compartment (foxa3) was normal. Stars represent the results of unpaired t-tests of mean difference = 0 (*p<0.05, **p<0.01, ***p<0.001). e) zeb1a and foxo1a 3' UTRs contain two miR-145 binding sites. Schematic illustration of the two putative binding sites of miR-145 in zeb1a and foxo1a 3′ UTRs. The position of the last base of the stop codon was numbered 0. Mutated (mBSs) miR-145 binding sites are indicated with stars. f) Disruption of miR-145 binding to zeb1a and foxo1a phenocopy miR-145 KD embryos. Confocal maximum projection of iSMCs covering the gut after Tagln staining of embryos co-injected with zeb1a and foxo1a TPs. Similar to miR-145 KD embryos, zeb1a+foxo1a TPs showed less iSMCs displaying an immature morphology. Scale bar, 25 μm. |